---
title: "Lecture 03"
subtitle: "Linear Regression Model with Stan"
author: "Jihong Zhang"
institute: "Educational Statistics and Research Methods"
title-slide-attributes:
data-background-image: ../Images/title_image.png
data-background-size: contain
data-background-opacity: "0.9"
execute:
echo: true
warning: false
format:
html:
code-tools: true
code-line-numbers: false
code-fold: false
code-summary: 'Click here to see R code'
number-offset: 1
fig.width: 10
fig-align: center
message: false
revealjs:
logo: ../Images/UA_Logo_Horizontal.png
incremental: true # choose "false "if want to show all together
theme: [serif, ../pp.scss]
footer: <https://jihongzhang.org/posts/2024-01-12-syllabus-adv-multivariate-esrm-6553>
transition: slide
background-transition: fade
slide-number: true
chalkboard: true
number-sections: false
code-block-bg: true
code-block-border-left: "#31BAE9"
code-line-numbers: true
code-annotations: hover
code-copy: false
output-file: slides-index.html
---
## Today's Lecture Objectives
1. An Introduction to MCMC (Markov Chain Monte Carlo)
2. An Introduction to Stan
3. Example: Linear Regression
but, before we begin...
1. Go through qmd file [Lecture03.qmd]{.underline};
2. Download R file [DietDataExample.R]{.underline} and data file [DietData.csv]{.underline}
## Quiz:
1. What is a conjugate prior?
2. Why we want to use conjugate priors?
## In previous class...
1. We worked with the simplest Bayesian model: roll "1" from a 6-size dice
2. We talked about the selection of prior distributions from uninformative to informative priors
3. We talked about binomial distribution as the likelihood function
4. The posterior distribution is directly derived by update $\alpha$ and $\beta$
## Markov Chain Monte Carlo (MCMC) Estimation
Today, we dive deeper into the estimation process.
1. Bayesian analysis is about estimating the **posterior distribution** and **model evaluation**.
2. Up until now, we've worked with the posterior distribution that are well-known
- Beta-Binomial conjugate pairs had a Beta posterior distribution
- In general, likelihood distributions from the exponential family have conjugate priors
-
> Conjugate prior: the family of the prior is equivalent to the family of posterior.
------------------------------------------------------------------------
### Why not keep using conjugate priors for all scenarios?
- Oftentimes, however, posterior distributions are not easily obtainable
- No longer able to use properties of the distribution to estimate parameters
- It is possible to use an optimization algorithm (e.g., Newton-Raphson or Expectation-Maximization) to find maximum value of posterior distribution
- But, such algorithms may be very time consuming for high-dimensional problems
- Instead: "sketch" the posterior by sampling from it - then use that sketch to make inference
- Sampling is done via MCMC
------------------------------------------------------------------------
### MCMC algorithm
::::: columns
::: {.column width="50%"}
1. To construct "posterior distribution", MCMC algorithm iteratively draws samples from the posterior distribution
- For fairly simplistic models, each iteration has independent samples
- Most models have some layers of dependency included
- which can slow down the sample process from the posterior distribution
- One problem of slowness of MCMC is high-dimensional problems
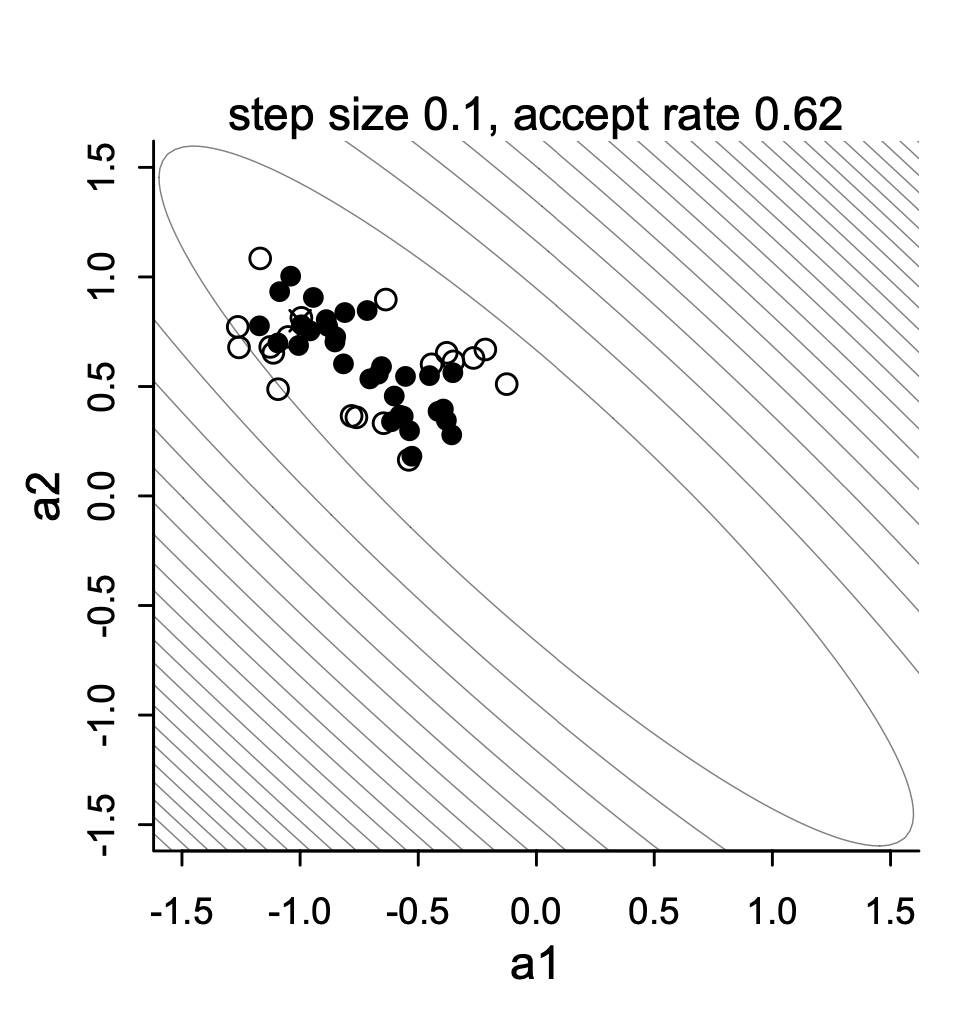
2. This plot shows one variant of MCMC - Metropolis sampling draws for two highly correlated parameters
:::
::: {.column width="50%"}
:::
:::::
------------------------------------------------------------------------
### Variations of MCMC algorithms
- Most of these specific algorithms use one of two types sampling:
1. Direct sampling from the posterior distribution (i.e., *Gibbs sampling*)
- Often used when conjugate priors are specified
- Popular software: BUGS, JAGS, Mplus
2. Indirect (rejection-based) sampling from the posterior distribution (e.g., Metropolis-Hastings, Hamiltonian Monte Carlo)
- Popular software: Stan
------------------------------------------------------------------------
### Making MCMC Algorithms
- Efficiency is the main reason for many algorithms
- Efficiency in this context: How quickly the algorithm converges and provides adequate coverage ("sketching") of the posterior distribution
- No one algorithm is uniformly most efficient for all models (here model = likelihood $\times$ prior)
- The good news is that many software packages (Stan, JAGS, Mplus, especially) don't make you choose which specific algorithm to use.
- The bad news is that sometimes your model may take a large amount of time to reach convergence (think days or weeks)
- Alternatively, you can code your own custom algorithm to make things run smoother (different priors/ sampling strategies).
------------------------------------------------------------------------
### Commonalities Across MCMC Algorithms
- Despite having fairly broad differences regarding how algorithms sample from the posterior distribution, there are quite a few things that are similar across algorithms:
1. A period of the Markov chain where sampling is not directly from the posterior
- The **burnin** period (sometimes coupled with other tuning periods and called **warmup**)
2. Methods used to assess convergence of the chain to the posterior distribution
- Often involving the need to use multiple chains with independent and differing starting values
3. Summaries of the posterior distribution
- Further, rejection-based sampling algorithms (e.g., Metropolis) often need a tuning period to make the sampling more efficient
- The tuning period comes before the algorithm begins its *burnin* period
------------------------------------------------------------------------
### MCMC Demonstration
- To demonstrate each type of algorithm, we will use a model for a normal distribution
1. We will investigate each briefly
2. We will then switch over to Stan to show the syntax and let Stan work
3. Finally, we will conclude by talking about assessing convergence and how to report parameter estimates
------------------------------------------------------------------------
## Example Data: Post-Diet Weights
- Download example data [UCLA website](https://stats.idre.ucla.edu/spss/library/spss-libraryhow-do-i-handle-interactions-of-continuous-andcategorical-variables/)
- Information about data:
- In this example data file, it contains **30** subjects who used one of three diets: diet 1 (diet=1), diet 2 (diet=2), and a control group (diet=3).
- The file **DietData.csv** contains the data we needed.
- Variables in the data set are:
1. Respondent: Respondent ID 1-30
2. DietGroup: 1, 2, 3 representing the group to which a respondent was assigned
3. HeightIN: The respondents' height in inches
4. WeightLB (*Dependent Variable*): The respondents' weight in pounds
- **Research Question**: [Are there differences in final weights between the three diet groups, and, if so, what the nature of the differences?]{.underline}
- Before we conduct the analysis, let's look at the data
------------------------------------------------------------------------
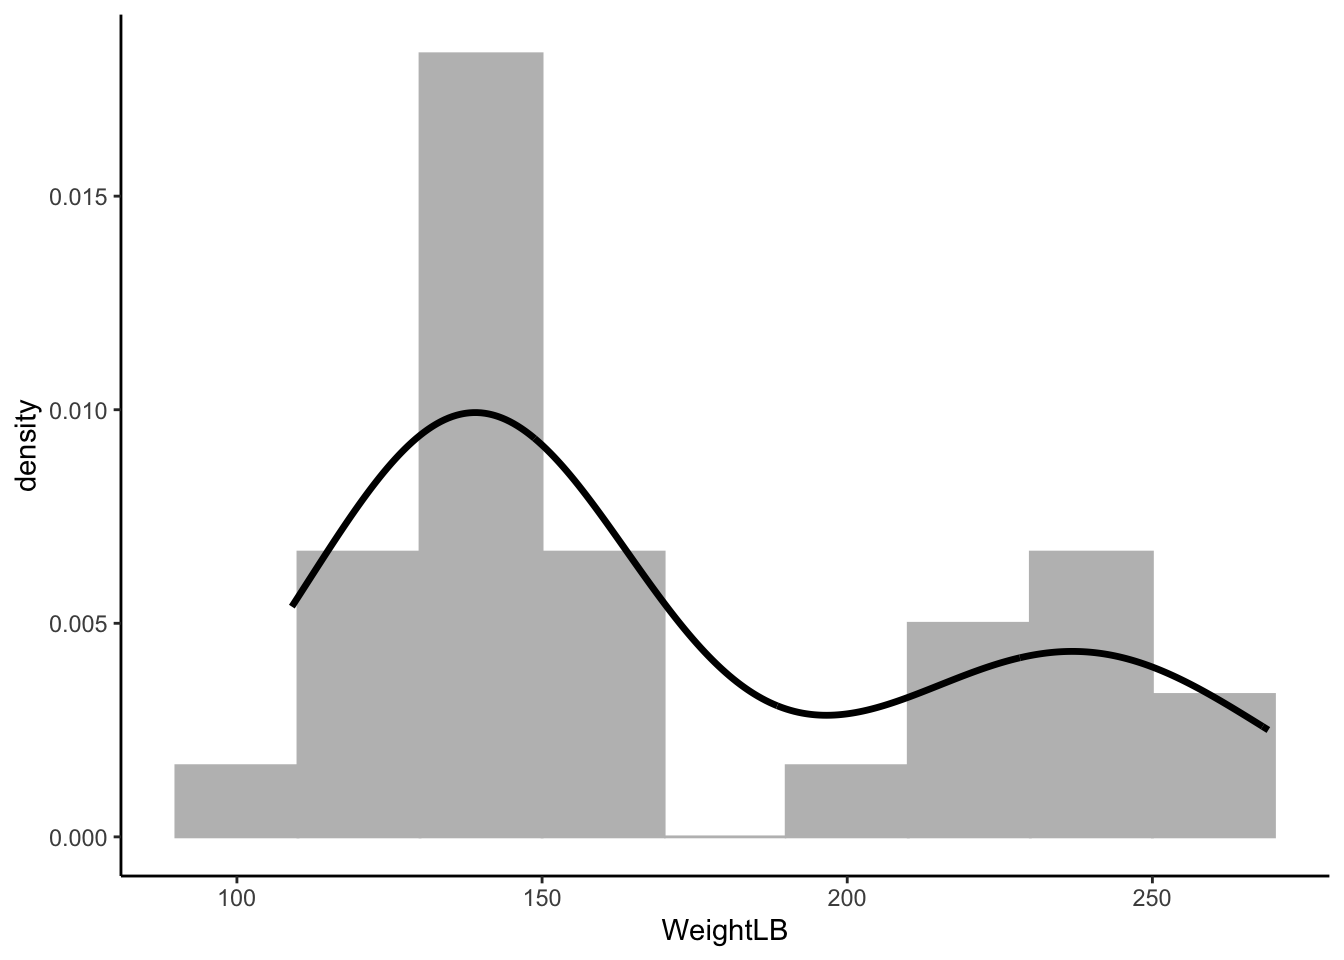
### Visualizing Data: *WeightLB* variable
::::: columns
::: {.column width="50%"}
::: {data-annotation="Read in data and look at the first few rows"}
```{r}
library(ggplot2) # R package for data visualization
# read in data
dat <- read.csv(here::here("teaching",'2024-01-12-syllabus-adv-multivariate-esrm-6553', 'Lecture03', 'Code', 'DietData.csv'))
dat$DietGroup <- factor(dat$DietGroup, levels = 1:3)
head(dat)
```
:::
:::
::: {.column width="50%"}
```{r}
# Histplot for WeightLB - Dependent Variable
ggplot(dat) +
  geom_histogram(aes(x = WeightLB, y = ..density..),
                 position = "identity", binwidth = 20, fill = 'grey', col = 'grey') +
  geom_density(aes(x = WeightLB), alpha = .2, size = 1.2) +
  theme_classic()
```
:::
:::::
------------------------------------------------------------------------
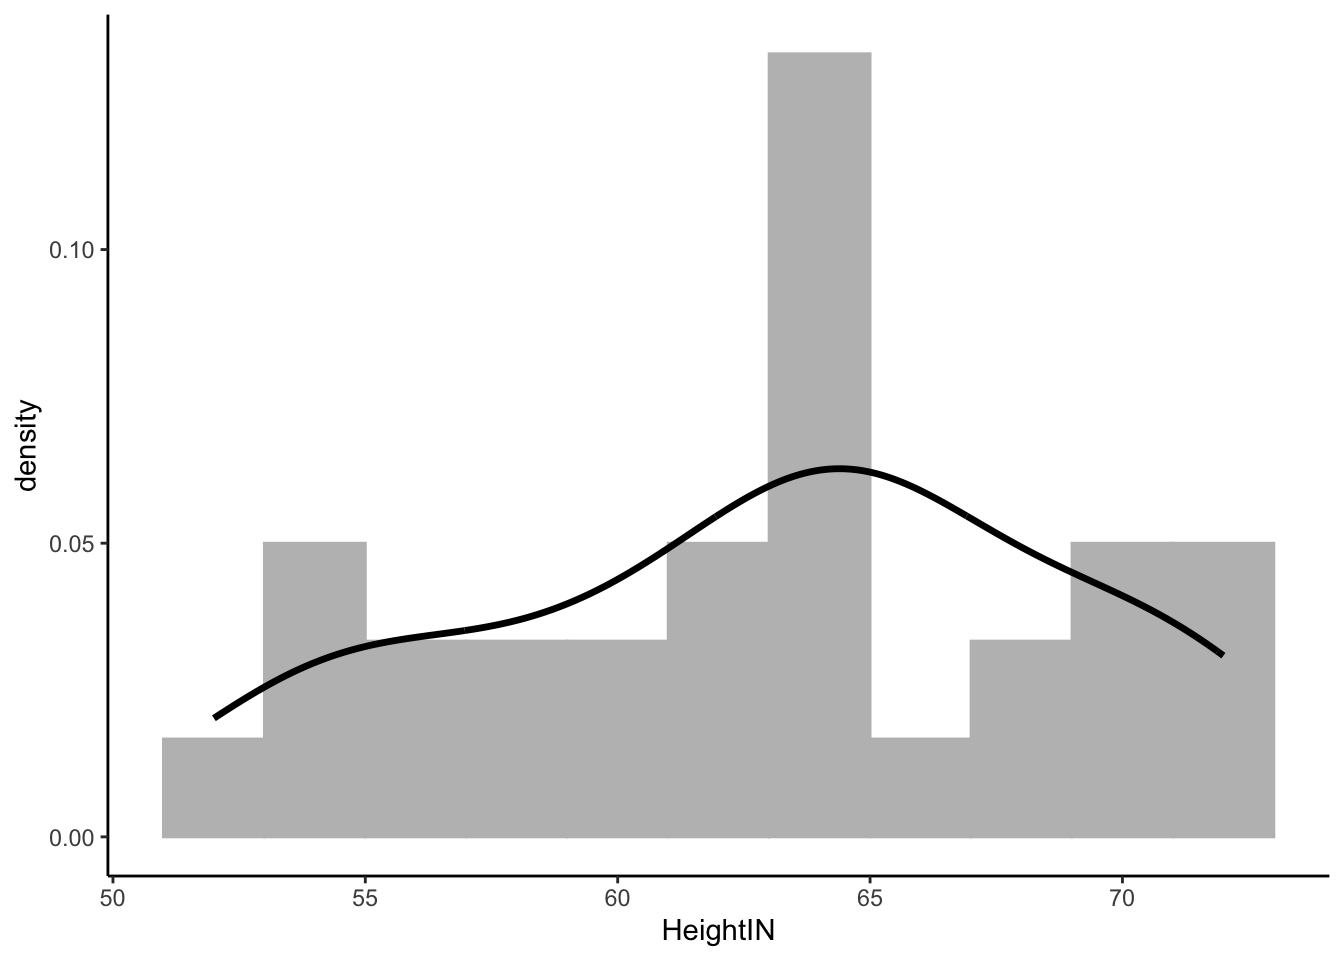
### Visualize Data: HeightIN Variable
```{r}
# Histogram for HeightIN - Independent Variable
ggplot(dat) +
  geom_histogram(aes(x = HeightIN, y = ..density..),
                 position = "identity", binwidth = 2, fill = 'grey', col = 'grey') +
  geom_density(aes(x = HeightIN), alpha = .2, size = 1.2) +
  theme_classic()
```
------------------------------------------------------------------------
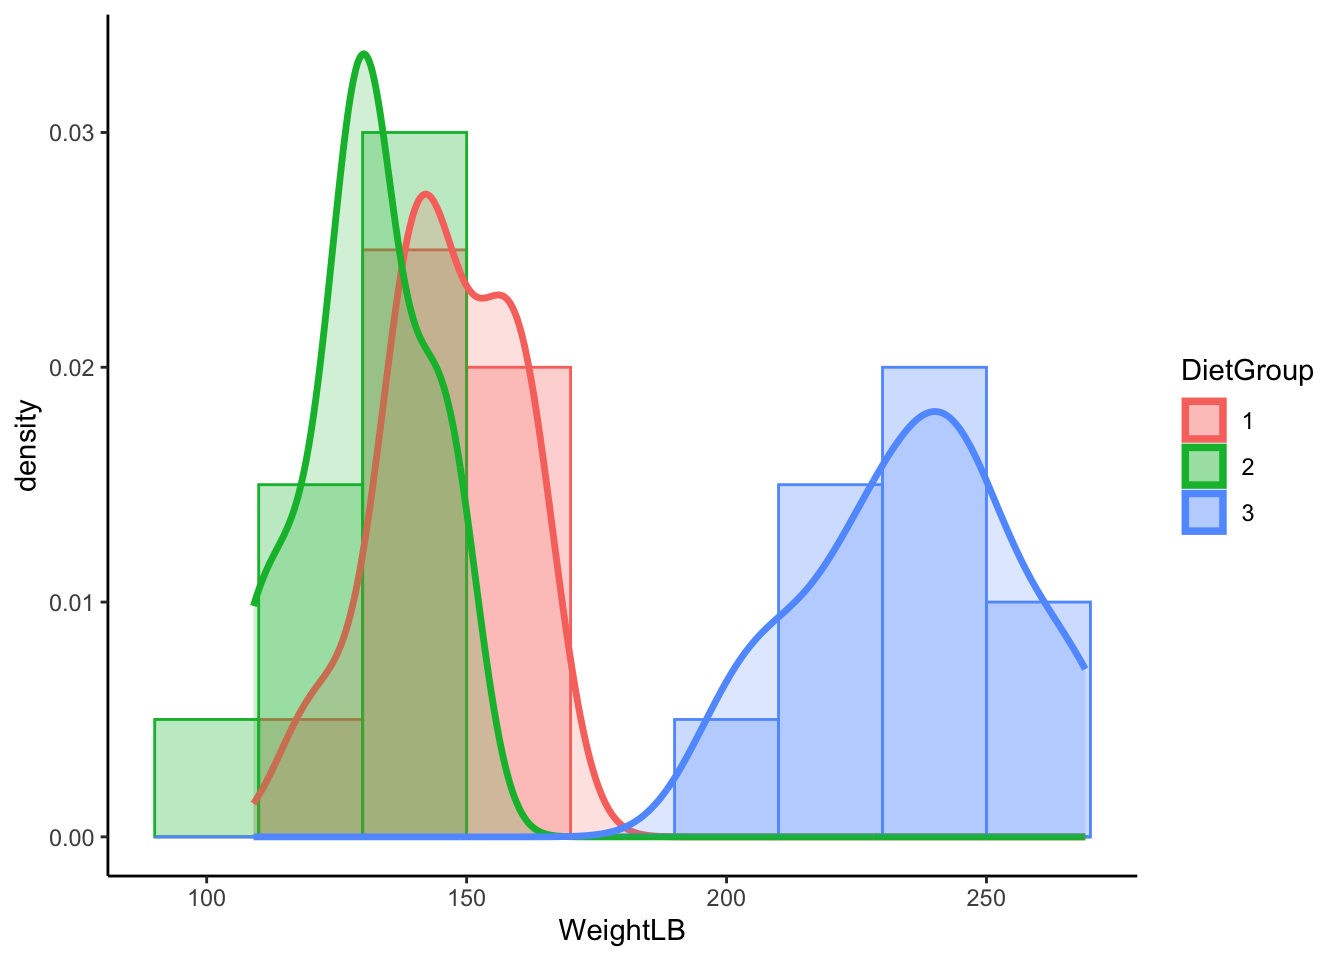
### Visualize Data: WeightLB by DietGroup
```{r}
# Histogram for WeightLB x Group
ggplot(dat, aes(x = WeightLB, fill = DietGroup, col = DietGroup)) +
  geom_histogram(aes(y = ..density..), position = "identity", binwidth = 20, alpha = 0.3) +
  geom_density(alpha = .2, size = 1.2) +
  theme_classic()
```
------------------------------------------------------------------------
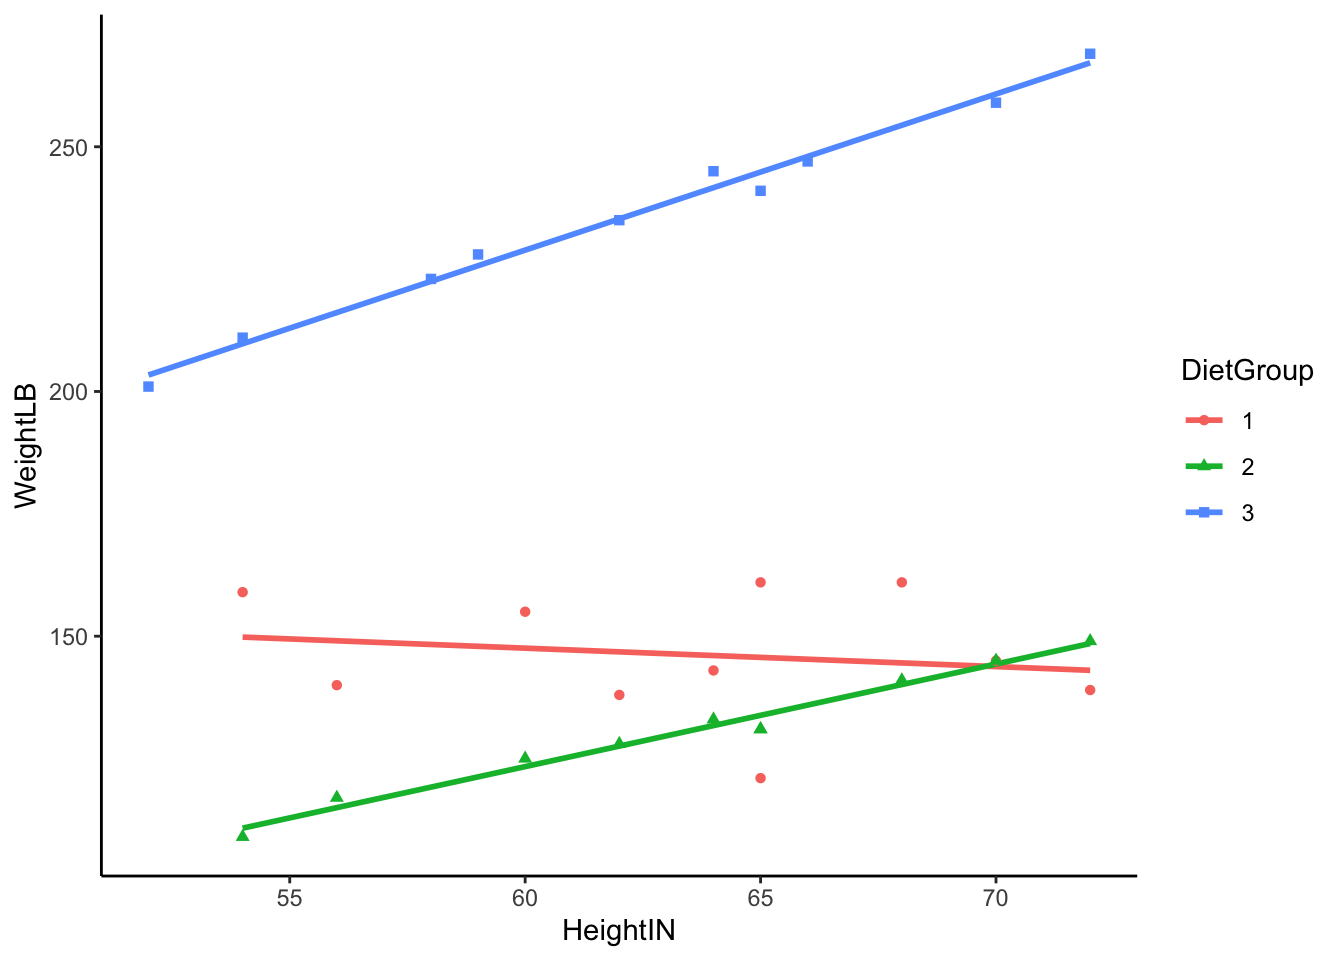
### Visualizing Data: WeightLB by HeightIN by DietGroup
```{r}
# Histogram for WeightLB x HeightIN x Group
ggplot(dat, aes(y = WeightLB, x = HeightIN, col = DietGroup, shape = DietGroup)) +
  geom_smooth(method = 'lm', se = FALSE) +
  geom_point() +
  theme_classic()
```
------------------------------------------------------------------------
### Class Discussion: What do we do?
Now, your turn to answer (statistical) questions:
1. What type of analysis seems most appropriate for these data?
2. Is the dependent variable (**WeightLB**) is appropriate as-is for such analysis or does it need transformed?
3. Are the independent variables (**HeightIN, DietGroup**) is appropriate as-is for such analysis or does it need transformed?
Scientific Judgement...
------------------------------------------------------------------------
### Linear Model with `Stan`
::::: columns
::: {.column width="50%"}
```{r}
# Linear Model with Least Squares
## Center independent variable - HeightIN for better interpretation
dat$HeightIN <- dat$HeightIN - 60

## an empty model suggested by data
EmptyModel <- lm(WeightLB ~ 1, data = dat)

## Examine assumptions and leverage of fit
### Residual plot, Q-Q residuals, Scale-Location
# plot(EmptyModel)

## Look at ANOVA table
### F-values, Sum/Mean of square of residuals
# anova(EmptyModel)

## look at parameter summary
summary(EmptyModel)
```
:::
::: {.column width="50%"}
```{r}
model.matrix(EmptyModel)
```
:::
:::::
------------------------------------------------------------------------
### Path Diagram of the Full Model
::::: columns
::: {.column width="30%"}
```{mermaid}
%%| echo: false
flowchart LR
  id1[(Empty Model)] ====> id2[(Full Model)]
```
Full model includes all effects (main effects, interaction effect):
1. What each arrow means? how to interpret them?
2. Can the three interaction term be included in the model? why?
:::
::: {.column width="70%"}
```{mermaid}
%%| echo: false
graph LR;
  HeightIN60 --> WeightLB;
  DietGroup2 --> WeightLB;
  DietGroup3 --> WeightLB;
  HeightIN60xDietGroup2 --> WeightLB;
  HeightIN60xDietGroup3 --> WeightLB;
  HeightIN60xDietGroup2xDietGroup3 x-.-x WeightLB;
```
:::
:::::
------------------------------------------------------------------------
### Steps in an MCMC Analysis
1. Model Building:
- Specify the model
- Specify prior distribution for all parameters
- Build model syntax as needed
2. Model Estimation:
- Specify warmup/burnin and sampling period lengths
- Run Markov chains
3. Model Evaluation:
- Evaluate chain convergence
- Interpret/report results
------------------------------------------------------------------------
### Specified the Model
- To begin, let's start with an empty model and build up from there
- Let's examine the linear model we seek to estimate:
$$
\text{WeightLB}_i = \beta_0 + e_i
$$
Where: $e_i \sim N(0, \sigma^2_{e})$
- Questions here:
- What are the variables in this analysis?
- What are the parameters in this analysis?
------------------------------------------------------------------------
## Introduction to Stan
- Stan is an MCMC estimation program
- Most recent; has many convenient features
- Actually does several methods of estimation (ML, Variational Bayes)
- You create a model using Stan's syntax (`.stan`)
- Stan translates your model to a custom-built C++ syntax
- Stan then compiles your model into its own executable program
- You then run the program to estimate your model in R
- If you use R, the interface can be seamless
------------------------------------------------------------------------
### Stan and Rstudio
::::: columns
::: {.column width="50%"}
- Option 1: Stan has its own syntax which can be built in stand-alone text files (.stan)
- Rstudio will let you create a stan file in the new `File` menu
- Rstudio also has syntax highlighting in Stan files
- Save `.stan` to the same path of your `.r`
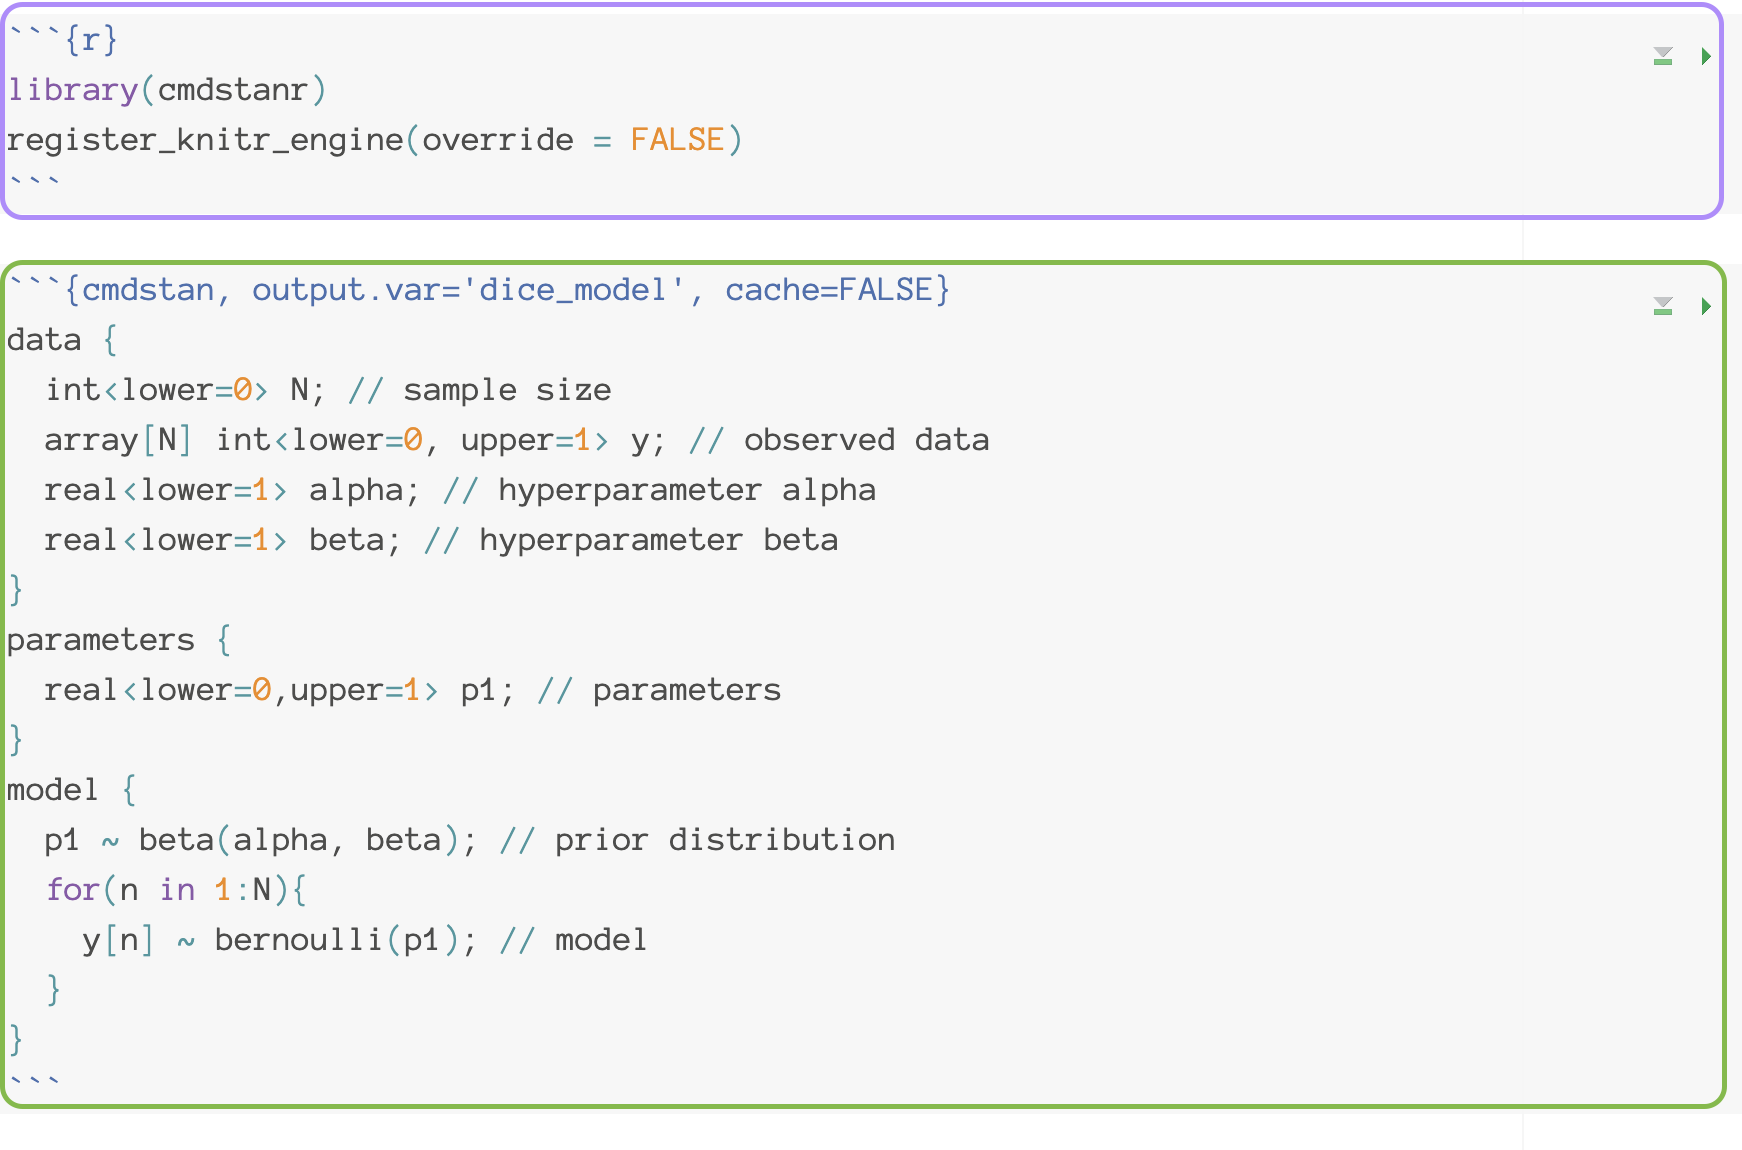
- Option 2: You can also use Stan in a interactive way in **qmd** file
- Which is helpful when you want to test multiple stan models and report your results at the same time
:::
::: {.column width="50%"}
{width="200"}
{width="450"}
:::
:::::
------------------------------------------------------------------------
### Stan Syntax
```{r}
#| echo: false
library(cmdstanr)
register_knitr_engine(override = FALSE)
set_cmdstan_path("~/.cmdstan/cmdstan-2.34.1/")
# rebuild_cmdstan("~/.cmdstan/cmdstan-2.34.1/")
```
A Stan file saved as `EmptyModel.stan`
- Each line ends with a semi colon `;`
- Comments are put in with `//`
- Each block starts with `block type` and is surrounded by curly brackets `{}`
```{.stan}
data { //#<1>
int<lower=0> N; //#<2>
vector[N] y; // #<3>
}
parameters { //#<4>
real beta0; //#<5>
real<lower=0> sigma; //#<6>
}
model { // #<7>
beta0 ~ normal(0, 1000); //#<8>
sigma ~ uniform(0, 100000); // #<9>
y ~ normal(beta0, sigma); // #<10>
}
```
1. the `data` block include the observed information
2. sample size (declared as a integer value)
3. dependent variable (declared as vector with the length as sample size)
4. the `parameter` block includes all parameters we want to estimate
5. intercept parameter
6. standard deviation of residuals
7. the `model` block includes the prior information and likelihood
8. prior distribution for `beta_0`
9. prior distribution for SD of residuals
10. likelihood function for observed data
------------------------------------------------------------------------
### Stan Data and Parameter Declaration
::::: columns
::: {.column width="50%"}
```{r filename="EmptyModel.stan"}
#| eval: false
data {
  int<lower=0> N;
  vector[N] y;
}
```
- Like many compiled languages (e.g., Java, C++), Stan expects you to declare what types of data/parameters you are defining:
- `int`: Integer values (no decimals)
- `real`: Floating point numbers
- `vector`: A one-dimensional set of real valued numbers
:::
::: {.column width="50%"}
- Sometimes, additional definitions are provided giving the range of the variable (or restricting the set of starting values):
- See [here](https://mc-stan.org/docs/reference-manual/data-types.html) for more information about data types in Stan.
- `real<lower=0> sigma` ;
- For `vector` or `matrix` or `array` , we may need to add size to tell Stan how many elements it has.
- `vector[N]` has N elements
:::
:::::
------------------------------------------------------------------------
### Stan Data and Prior Distributions
```{r filename="EmptyModel.stan"}
#| eval: false
model {
  beta0 ~ normal(0, 1000);
  sigma ~ uniform(0, 100000);
  y ~ normal(beta0, sigma);
}
```
::: nonincremental
- In the model block, we need to define the prior distribution for the model and the priors
- The left-hand side is either defined in data or parameters
- The right-hand side is a distribution included in Stan
- You can define your own distribution (see [here](https://mc-stan.org/docs/functions-reference/index.html) for more information)
- If you have hyperparameters, you can consider them as same as parameters
:::
```{r filename="EmptyModel.stan"}
#| eval: false
data {
...
real<lower=0> betaSigma; #<1>
real<lower=0> sigmaMax; #<2>
}
model {
beta0 ~ normal(0, betaSigma);
sigma ~ uniform(0, sigmaMax);
...
}
```
1. You provide Stan with the SD of intercept
2. You provide Stan with the maximum of sigma
------------------------------------------------------------------------
### From Stan Syntax to Compilation
```{r filename="DietDataExample.R"}
# compile model -- this method is for stand-alone stan files (uses cmdstanr)
model00.fromFile = cmdstan_model(stan_file = here::here("teaching/2024-01-12-syllabus-adv-multivariate-esrm-6553/Lecture03/Code/EmptyModel.stan"))
```
```{r}
#| eval: false
# or this method using the string text in R
stanModel <- "
data {
int<lower=0> N;
vector[N] y;
}
parameters {
real beta0;
real<lower=0> sigma;
}
model {
beta0 ~ normal(0, 1000);
sigma ~ uniform(0, 100000);
y ~ normal(beta0, sigma);
}
"
model00.fromString = cmdstan_model(stan_file = write_stan_file(stanModel)) #<1>
```
1. stanModel is a character containing the entire Stan program
::: nonincremental
- Once you have your syntax, next you need to have Stan translate it into C++ and compile an executable. The default argument `compile = TRUE` make a executable file `EmptyModel` for you.
:::
------------------------------------------------------------------------
### CmdStanModel Object
```{r filename="DietDataExample.R"}
names(model00.fromFile)#<1>
```
1. `model00.fromFile` is a R6 class object. All functions towards this object are stored inside itself.
::: nonincremental
- Some important functions include `$sample()` or `$diagnose()`
- `cmdstanr` wants you to compile first, then run the Markov chain
- Check [here](https://mc-stan.org/cmdstanr/reference/CmdStanModel.html) for more details of functions.
:::
------------------------------------------------------------------------
### Building Data for Stan
```{r filename="DietDataExample.R"}
#| eval: true
# build R list containing data for Stan: Must be named what "data" are listed in analysis
stanData = list(
N = nrow(dat), #<1>
weightLB = dat$WeightLB #<2>
)
```
1. Sample size, `nrow()` calculates the number of rows of data
2. Vector of dependent variable
::: nonincremental
- Stan needs the data you declared in you syntax to be able to run
- Within R, we can pass this data list to Stan via a list object
- The entries in the list should correspond to the data block of the Stan syntax
- The R list object is the same for `cmdstanr` and `rstan`
:::
------------------------------------------------------------------------
### Run Markov Chains in CmdStanr
```{r filename="DietDataExample.R"}
#| eval: true
#| results: hide
#| message: false
# run MCMC chain (sample from posterior)
model00.samples = model00.fromFile$sample(
data = stanData, #<1>
seed = 1, #<2>
chains = 4, #<3>
parallel_chains = 4, #<4>
iter_warmup = 10000, #<5>
iter_sampling = 10000, #<6>
show_messages = FALSE # Change it to TRUE to show MCMC
)
```
1. Data list
2. Random number seed
3. Number of chains (and parallel chains)
4. Number of warmup iterations (more details shortly)
5. Number of sampling iterations
::: nonincremental
- Within the compiled program and the data, the next step is to run the Markov Chain Monte Carlo (MCMC) sampling (this is basically equivalent to drawing from a posterior distribution)
- In `cmdstanr`, running the MCMC sampling comes from the `$sample()` function that is part of the compiled program object
:::
------------------------------------------------------------------------
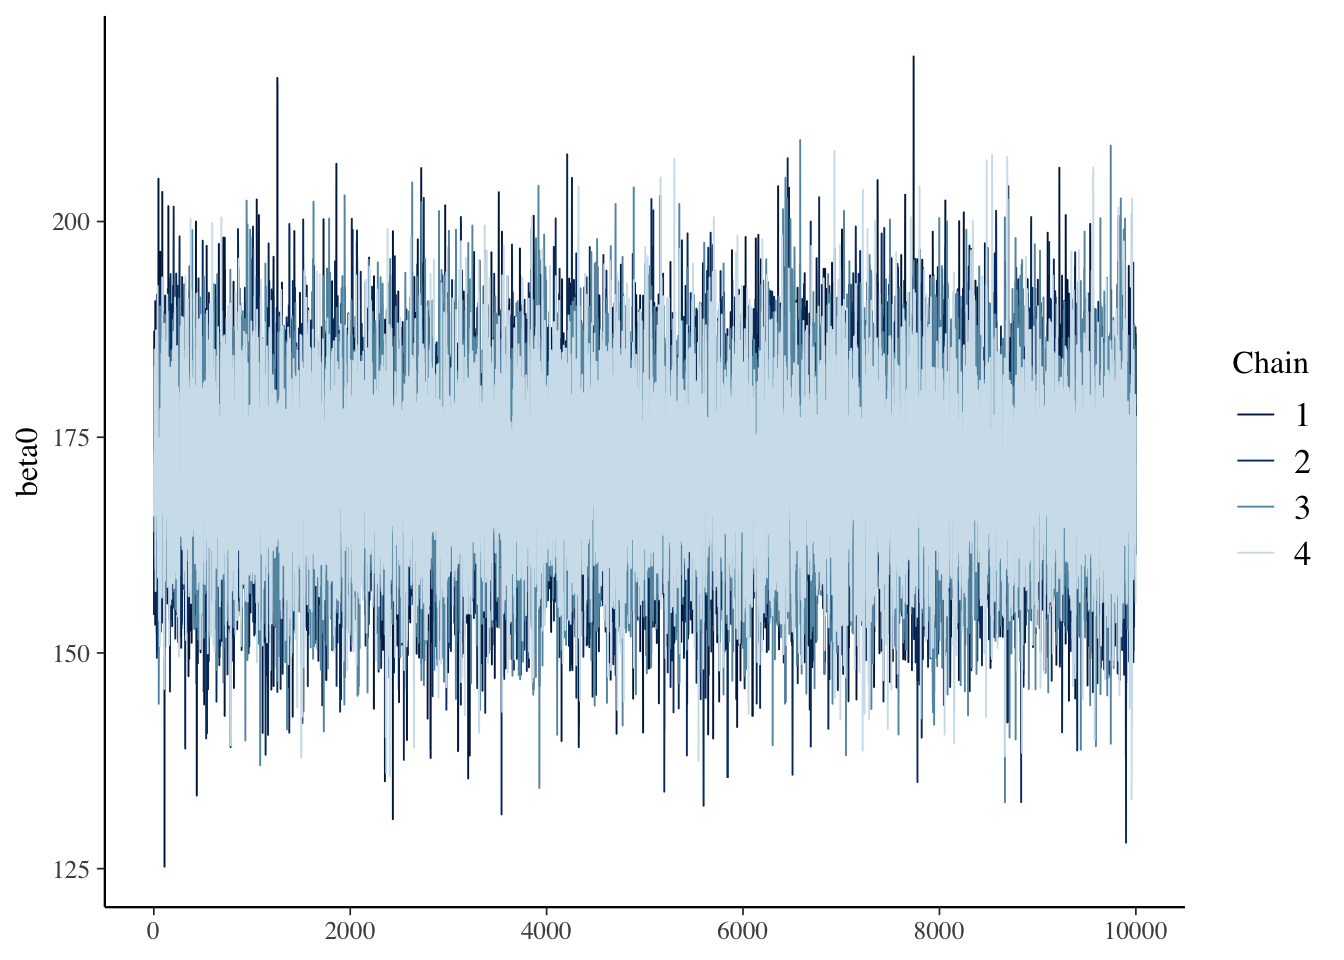
### Sampling posterior distribution of beta0
```{r}
bayesplot::mcmc_trace(model00.samples$draws("beta0"))
```
------------------------------------------------------------------------
### MCMC Process
::: nonincremental
- The MCMC algorithm runs as a series of discrete iterations
- Within each iteration, each parameter in the model has an opportunity to change its value
- For each parameter, a new parameter is sampled at random from the current belief of posterior distribution
- In Stan (Hamiltonian Monte Carlo), for a given iteration, a [proposed parameter]{.underline} is generated
- The posterior likelihood "values" (more than just density; includes likelihood of proposal) are calculated for the current and proposed values of the parameter
- Make a decision: the proposed values are accepted based on the draw of a uniform number compared to transition probability (random walk)
- If all models are specified correctly, then regardless of starting location, each chain will converge to the posterior if running long enough
- But, the chains must be checked for convergence when the algorithm stops (diagnosis)
:::
------------------------------------------------------------------------
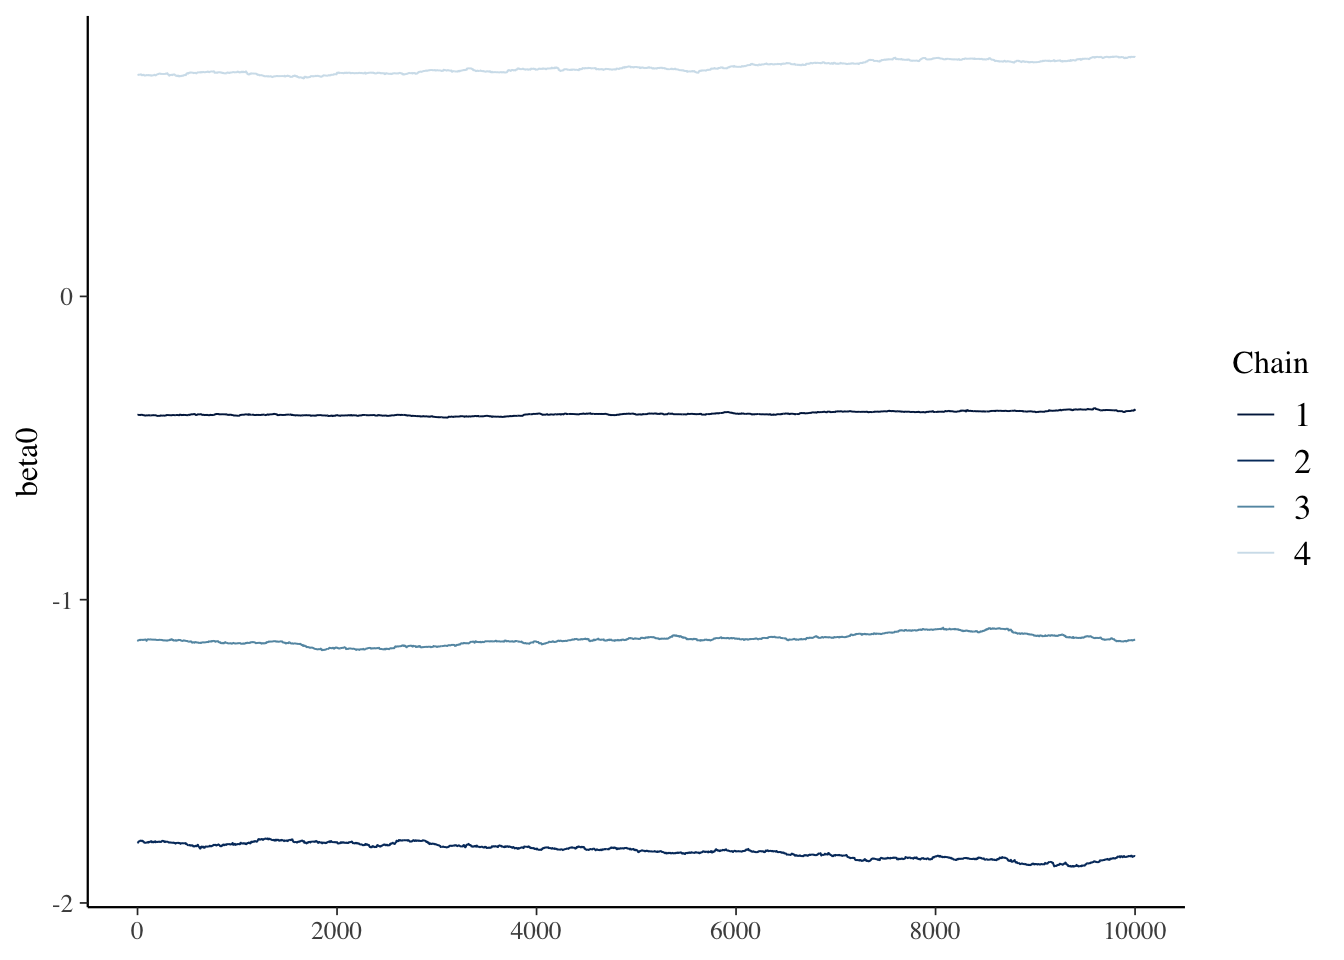
## Example of Poor Convergence
To compare with the previous MCMC results (`model00.samples`), next, let's create a `model00Poor.samples` with strange and strong prior.
::::: columns
::: {.column width="50%"}
```{r filename="EmptyModelPoor.stan"}
#| eval: false
model {
  beta0 ~ normal(50, 10); // prior for beta0
  sigma ~ uniform(0, 10); // prior for sigma
  y ~ normal(beta0, sigma); // model for observed data
}
```
```{r filename="DietDataExample.R"}
#| echo: true
#| results: 'hide'
## Model 0 with poor convergence
model00Poor.fromFile = cmdstan_model(stan_file = here::here("teaching/2024-01-12-syllabus-adv-multivariate-esrm-6553/Lecture03/Code/EmptyModelPoor.stan"), compile = FALSE)
model00Poor.fromFile$compile()
model00Poor.samples = model00Poor.fromFile$sample(
  data = stanData,
  seed = 1,
  chains = 4,
  parallel_chains = 4,
  iter_warmup = 10000,
  iter_sampling = 10000,
  refresh = 0
)
```
:::
::: {.column width="50%"}
```{r filename="DietDataExample.R"}
model00Poor.samples$summary()[c('variable','mean', 'rhat')]
bayesplot::mcmc_trace(model00Poor.samples$draws("beta0"))
```
:::
:::::
------------------------------------------------------------------------
### Markov Chain Convergence Diagnosis
1. Once Stan stops, the next step is to determine if the chains converged to their posterior distribution
- This is called ***convergence diagnosis***
2. Many methods have been developed for diagnosing if Markov chains have converged
- Two most common: visual inspection and Gelman-Rubin Potential Scale Reduction Factor (PSRF)
- Visual inspection
- Expect no trends in timeseries - should look like a catapillar
- Shape of posterior density should be mostly smooth
- Gelman-Rubin PSRF (denoted as $\hat{R}$)
- For analyses with multiple chains
- Ratio of between-chain variance to within-chain variance
- Should be near 1 (maximum somewhere under 1.1)
------------------------------------------------------------------------
### Setting MCMC Options
1. As convergence is assessed using multiple chains, more than one should be run
1. Between-chain variance estimates improve with the number of chains, so I typically use four chains
2. At least two chains are needed; more than two should work better
2. Warmup/burnin period should be long enough to ensure chains move to center of posterior distribution
1. This is difficult to determine ahead of time
2. More complex models need more warmup/burnin to converge
3. Sampling iterations should be long enough to thoroughly sample posterior distribution
1. This is difficult to determine ahead of time
2. Need smooth densities across bulk posterior
4. Often, multiple analyses (with different settings) is what is needed
------------------------------------------------------------------------
### The Markov Chain Traceplot
```{r filename="DietDataExample.R"}
bayesplot::mcmc_trace(model00.samples$draws("beta0"))
```
------------------------------------------------------------------------
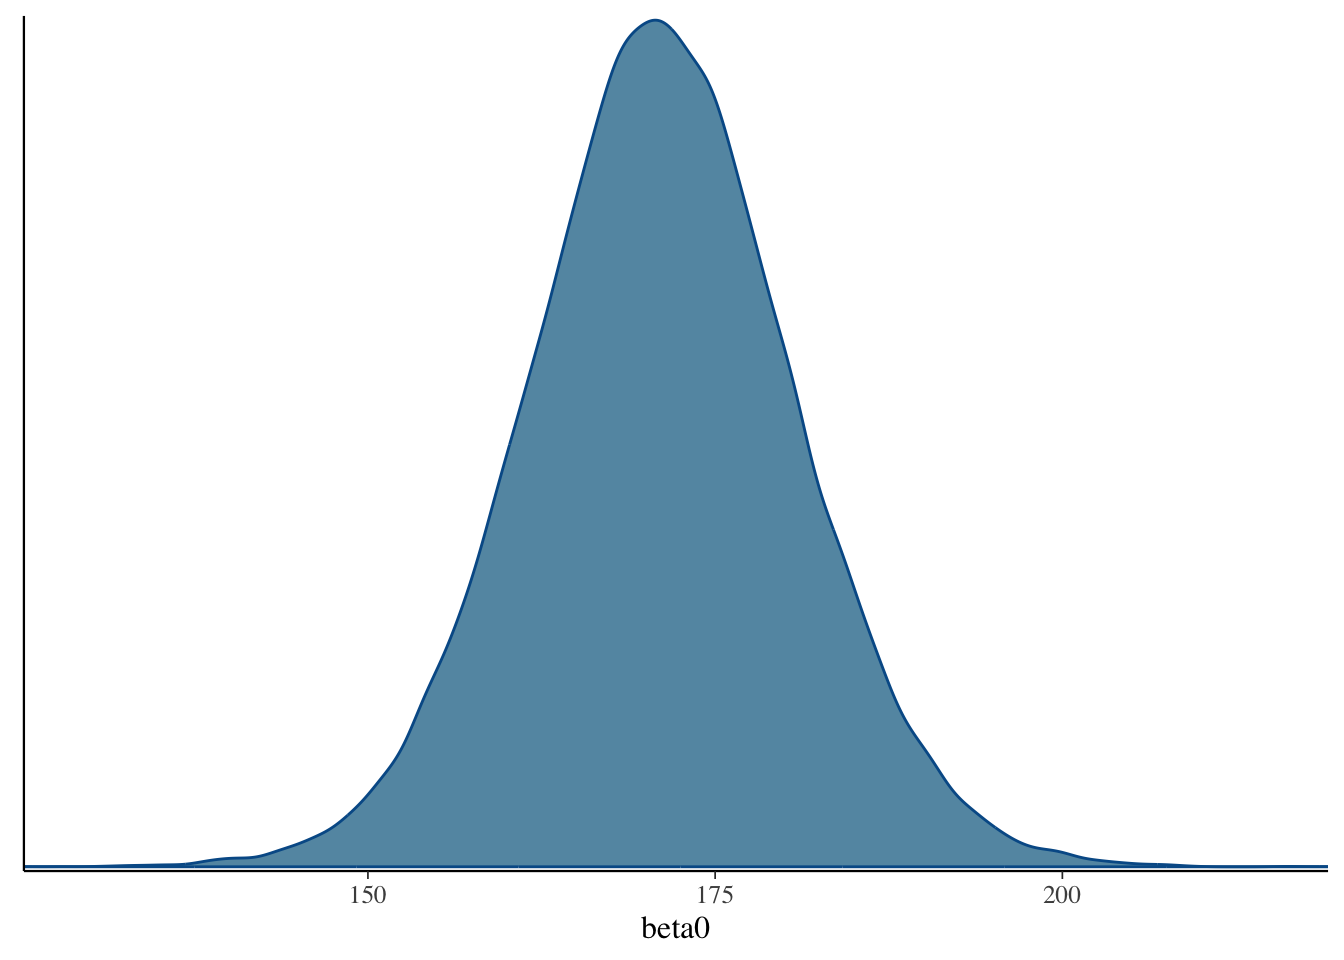
### The Posterior Distribution
```{r filename="DietDataExample.R"}
bayesplot::mcmc_dens(model00.samples$draws("beta0"))
```
------------------------------------------------------------------------
### Assessing Our Chains
```{r filename="DietDataExample.R"}
model00.samples$summary()[1:5]
```
- The `summary()` function reports the PSRF (also known as rhat)
- Here we look at two parameters: $\beta_0$ and $\sigma$
- Both have \$$\hat{R} = 1.00$, so both are converged
- `lp__` is so-called posterior log-likelihood, does not necessarily need examined, but may be used for model comparison
- `ess` columns show effective sample size for chains (factoring in autocorrelation between iterations)
- More is better
------------------------------------------------------------------------
### Results Interpretation: Part I
- At long last, with a set of converged Markov chains, we can now interpret the results
- Here, we disregard which chain samples came from and pool all sampled values to results
- We use summaries of posterior distributions when describing model parameters
- Typical summary: the posterior mean
- The mean of the sampled values in the chain
- Called EAP (Expected a Posteriori) estimates
- Less common: posterior median
- Important point:
- Posterior means are different than what characterizes the ML estimates
- Analogous to ML estimates would be the mode of the posterior distribution
- Especially important if looking at non-symmetric posterior distribution
- Look at posterior for variances
------------------------------------------------------------------------
### Results Interpretation: Part II
- To summarize the uncertainty in parameters, the posterior SD is used
- The standard deviation of the sampled values in the all chains
- This is analogous to the standard error from ML
- Bayesian credible intervals are formed by taking quantiles of the posterior distribution
- Analogous to confidence intervals
- Interpretation slightly different - the probability the parameter lies within the interval
- 95% credible interval notes that the parameter is within interval with 95% confidence
- Additionally, highest density posterior intervals can be formed
- The narrowest range for an interval (for unimodal posterior distributions)
------------------------------------------------------------------------
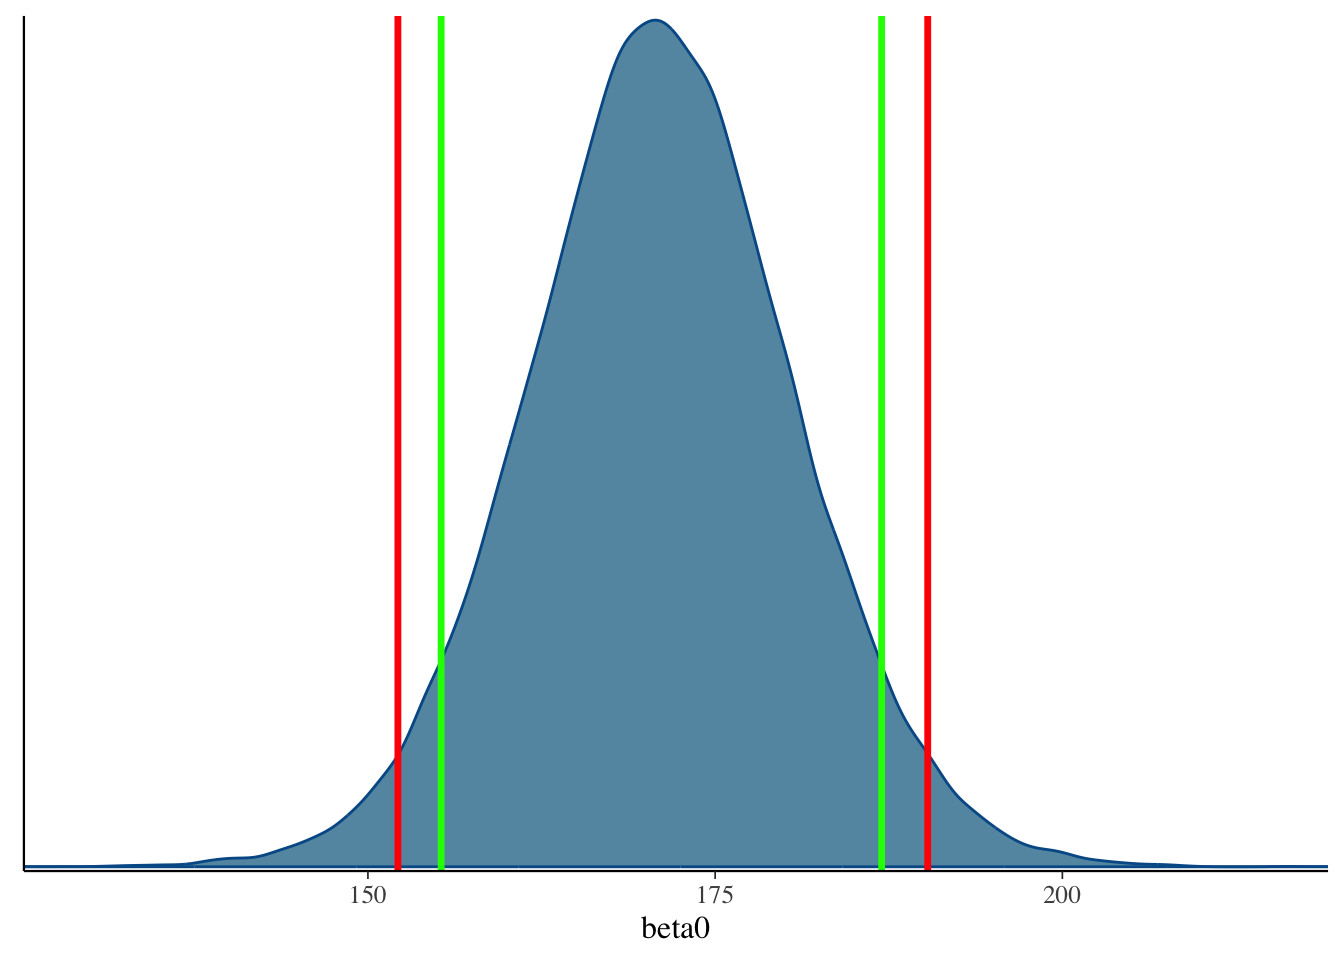
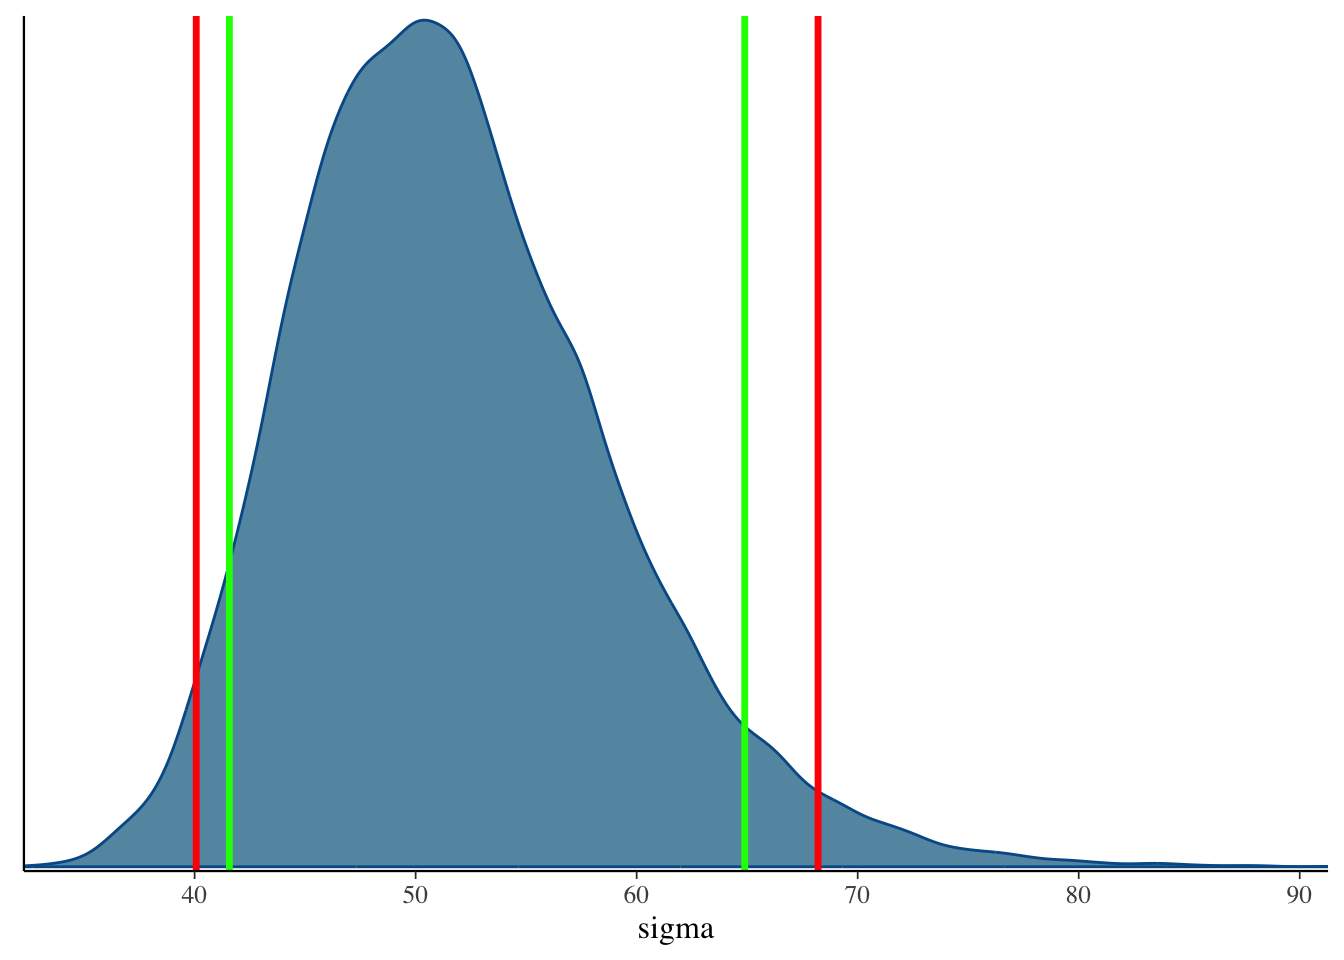
## 90% and 95% Credible Interval
::::: columns
::: {.column width="50%"}
```{r}
quantile(model00.samples$draws('beta0'), c(.05, .95))
quantile(model00.samples$draws('beta0'), c(.025, .975))
```
```{r}
bayesplot::mcmc_dens(model00.samples$draws('beta0')) +
  geom_vline(xintercept = quantile(model00.samples$draws('beta0'), c(.025, .975)), col = "red", size = 1.2) +
  geom_vline(xintercept = quantile(model00.samples$draws('beta0'), c(.05, .95)), col = "green", size = 1.2)
```
:::
::: {.column width="50%"}
```{r}
quantile(model00.samples$draws('sigma'), c(.05, .95))
quantile(model00.samples$draws('sigma'), c(.025, .975))
```
```{r}
bayesplot::mcmc_dens(model00.samples$draws('sigma')) +
  geom_vline(xintercept = quantile(model00.samples$draws('sigma'), c(.025, .975)), col = "red", size = 1.2) +
  geom_vline(xintercept = quantile(model00.samples$draws('sigma'), c(.05, .95)), col = "green", size = 1.2)
```
:::
:::::
------------------------------------------------------------------------
### Using `rstanarm` for simple Bayesian models
```{r}
library(rstanarm)
# Set this manually if desired:
ncores <- parallel::detectCores(logical = FALSE) - 1
###
options(mc.cores = ncores)
set.seed(5078022)
refm_fit <- stan_glm(
  WeightLB ~ 1,
  family = gaussian(),
  data = dat,
  ### 5000 warmups and 5000 samplings
  chains = 4, iter = 10000
)
summary(refm_fit)
```
------------------------------------------------------------------------
## Wrapping up
1. MCMC algorithm includes Bayes' theorem and sampling approaches
2. Stan syntax: need `.stan` storing the model information and `.r` storing R codes to run and summarize the model
3. `cmdstanr` will compile the `.stan` and run the MCMC
4. To run MCMC, you need to specify number of chains, iterations, burnins. You also translate data information into a data list
5. After you finish estimation, check the convergence using $\hat{R}$ and visual inspection of traceplot
**Key terminology introduced in this lecture:**
- **MCMC (Markov Chain Monte Carlo)**: Algorithm for sampling from posterior distributions
- **Conjugate prior**: Prior distribution from the same family as the posterior distribution
- **Gibbs sampling**: Direct sampling from the posterior distribution
- **Metropolis-Hastings**: Rejection-based sampling method
- **Hamiltonian Monte Carlo (HMC)**: Efficient rejection-based sampling used by Stan
- **Warmup/Burnin period**: Initial iterations before the chain converges to the posterior
- **Convergence**: State where the Markov chain samples from the target posterior distribution
- **Traceplot**: Visual diagnostic showing parameter values across iterations
- **PSRF (Potential Scale Reduction Factor)** or **$\hat{R}$ (rhat)**: Convergence diagnostic comparing between-chain to within-chain variance
- **ESS (Effective Sample Size)**: Number of independent samples accounting for autocorrelation
- **EAP (Expected a Posteriori)**: Posterior mean estimate
- **Credible interval**: Bayesian interval containing the parameter with specified probability
- **Stan blocks**: `data`, `parameters`, and `model` sections in Stan syntax