install.packages("tidyverse")Presentation Outline
Introduce ourselves
Go through the syllabus
Introduce R and RStudio
Self Introduction



It is your turn
Tell me:
- Your name
- Department name
- Which year in your program
- Anything else you want to share to others
Class Time
- Unit 1: 17:00 - 18:00
- Unit 2: 18:10 - 19:00
- Unit 3: 19:15 - 19:45 (Q&A; Practice with R Code on your laptop and Ask Questions)
What To Expect This Semester
I believe that everyone is capable and can significantly benefit from learning varied types of multivariate analysis
- The hard part is the working memory load, not the math
Philosophy: Focus on accessibility + learning-by-doing
The AMS class heavily emphasize on hands-on task-oriented practices
No anxiety-prone tasks (e.g., hand calculations, memorizing formulas)
No anxiety-prone methods of evaluation (e.g., timed tests)
Materials:
Lecture slides present concepts—the what and the why
Example documents: reinforce the concepts and demonstrate the how using software—R packages
All available at the course website (hosted outside of Blackboard)
- Let me can show you how to use the website
Course Requirements
In-class quizzes (20 points total): short formative assessments at the beginning of selected classes to refresh recent material
An opportunity for you to request topics for further clarification and review
Typically 1-3 questions that can be finished in 5-10 minutes
You must be present in class on the day a quiz is given to earn quiz points
4 homework assignments (HW1-4, 80 points total): Practice doing data analysis
About 20 points each
Homework 1-3: unique canned datasets answered through the online homework portal
Final Homework (Homework 4): individual data analysis + written results section
- Get my feedback for using a model of your choice on your data + optional revision
Extra credit (up to 2 points, HW0)
- I will show you how to use the system using Homework 0 as the example
Our Other Responsibility
My job (besides providing materials and assignments):
Answer questions via email, in individual meetings, or during office hours. You can work on homework during office hours and get immediate assistance.
- Email me first
Your job (in descending order of timely importance):
Ask questions—preferably in class, but any time is better than none
Frequently review the class material, focusing on mastering the vocabulary, logic, and procedural skills
Don’t wait until the last minute to start homework, and don’t be afraid to ask for help if you get stuck on one thing for more than 15 minutes
- Please email me (jzhang@uark.edu) a screenshot of your code+error so I can respond easily
Practice using the software to implement the techniques you are learning on data you care about
Do the readings for a broader perspective and additional example (best after the lecture)
More About Your Experience in this Class
Attendance: Strongly recommended
Please do not attend in-person if you might be sick!
In-class quiz points require being present on days when quizzes are given
I will post YouTube recordings (audio + screenshare) by request at the course website.
Changes will be sent via email by 9 am on class days
I will update the homework and in-class quiz links on class days. If not uploaded, then there are two situations: (1) I forget to do that. I will re-upload later and notify you by emails. (2) I decide not to upload it or remove it.
I may change to zoom-only for dangerous weather or if I am sick.
Statistical Software
I will show examples primarily using R and R packages. Some important R packages include:
Tidyverse: a comprehensive R package including multiple mini packages for multiple data cleaning, data transformation.
ggplot2: a popular package for data visualization
Why not SPSS?
SPSS could only be used for some—but not all–of our content
More importantly, it doesn’t have as much room to grow; R has many new packages being developed via CRAN and GitHub
Why not SAS?
SAS is not open-sourced, meaning that we cannot check source code if something goes wrong
SAS is also commercial, but R is free
Why not Python, Julia, STAT or other software (e.g., matlab)?
They are not so popular in the relevant fields of educational statistics, which means you cannot get much support from the community.
But I think Python and Julia are worth learning! If you have Python / Julia code or tips that related to our course, please share them with me! I will give you extra points
My story: I am a heavy-duty R user:
I use R for almost everything (like course/conference slides, website building, data analysis, paper writing)
I am also learning Julia and Python but not plan to add them to my classes
I know how to use Mplus but do not use it very often
Why R?
There are some point to consider
R packages are only as good as their authors (so little quality control)
Syntax and capabilities are idiosyncratic to the packages
The good things are:
If you really master R, you can do by yourself (write your own algorithm for complex model)
You can check the source code of R packages and know where issues come from
You can communicate with R package authors and provide some suggestions
You can be R package author yourself and be famous
Working with Programs Through Syntax
If you feel the class is not so challenging for you, you can see materials for my other class, ESRM 6553: Advanced Multivariate Analysis
I DO NOT need you to memorize syntax
Instead, you can do exactly what I (still) do:
Find the example source file for what you need to do
Figure out how to modify it to work for your homework
Copy (CTRL+C), paste (CTRL+V), and find and replace are your friends
Don’t hesitate to ask for help (i.e., email me a screenshot)
What You Are Supposed To Know Already
Formal prerequisite:
ESRM 64103. Experimental Design in Education, with a grade of C or better
ESRM 64203. Multiple Regression Techniques for Education, with a grade of C or better
What we will cover this semester:
Basic usage of R and RStudio (i.e., R download, package installation, package loading)
Descriptive statistics and bivariate associations (e.g., correlation)
Statistical concepts (e.g., null hypothesis testing, maximum likelihood estimation)
Generalized linear models (i.e., regression, ANOVA, path analysis, factor analysis)
This class will focus on multivariate analysis… so what is that?
What are Multivariate Analysis?
- Multivariate statistics is a subdivision of statistics encompassing the simultaneous observation and analysis of more than one outcome variable (Dependent Variables / DVs).
– Wikipedia
Many different multivariate analysis models used multivariate statistics:
Generalized linear regression
Principal components analysis (PCA)
Path analysis
Factor analysis (FA)
Network analysis (NA)
Why Use Multivariate Statistics
Compared to univariate analysis, Multivariate Statistics provides a more thorough picture of the reality.
Imagine our theory of depression support following two models:
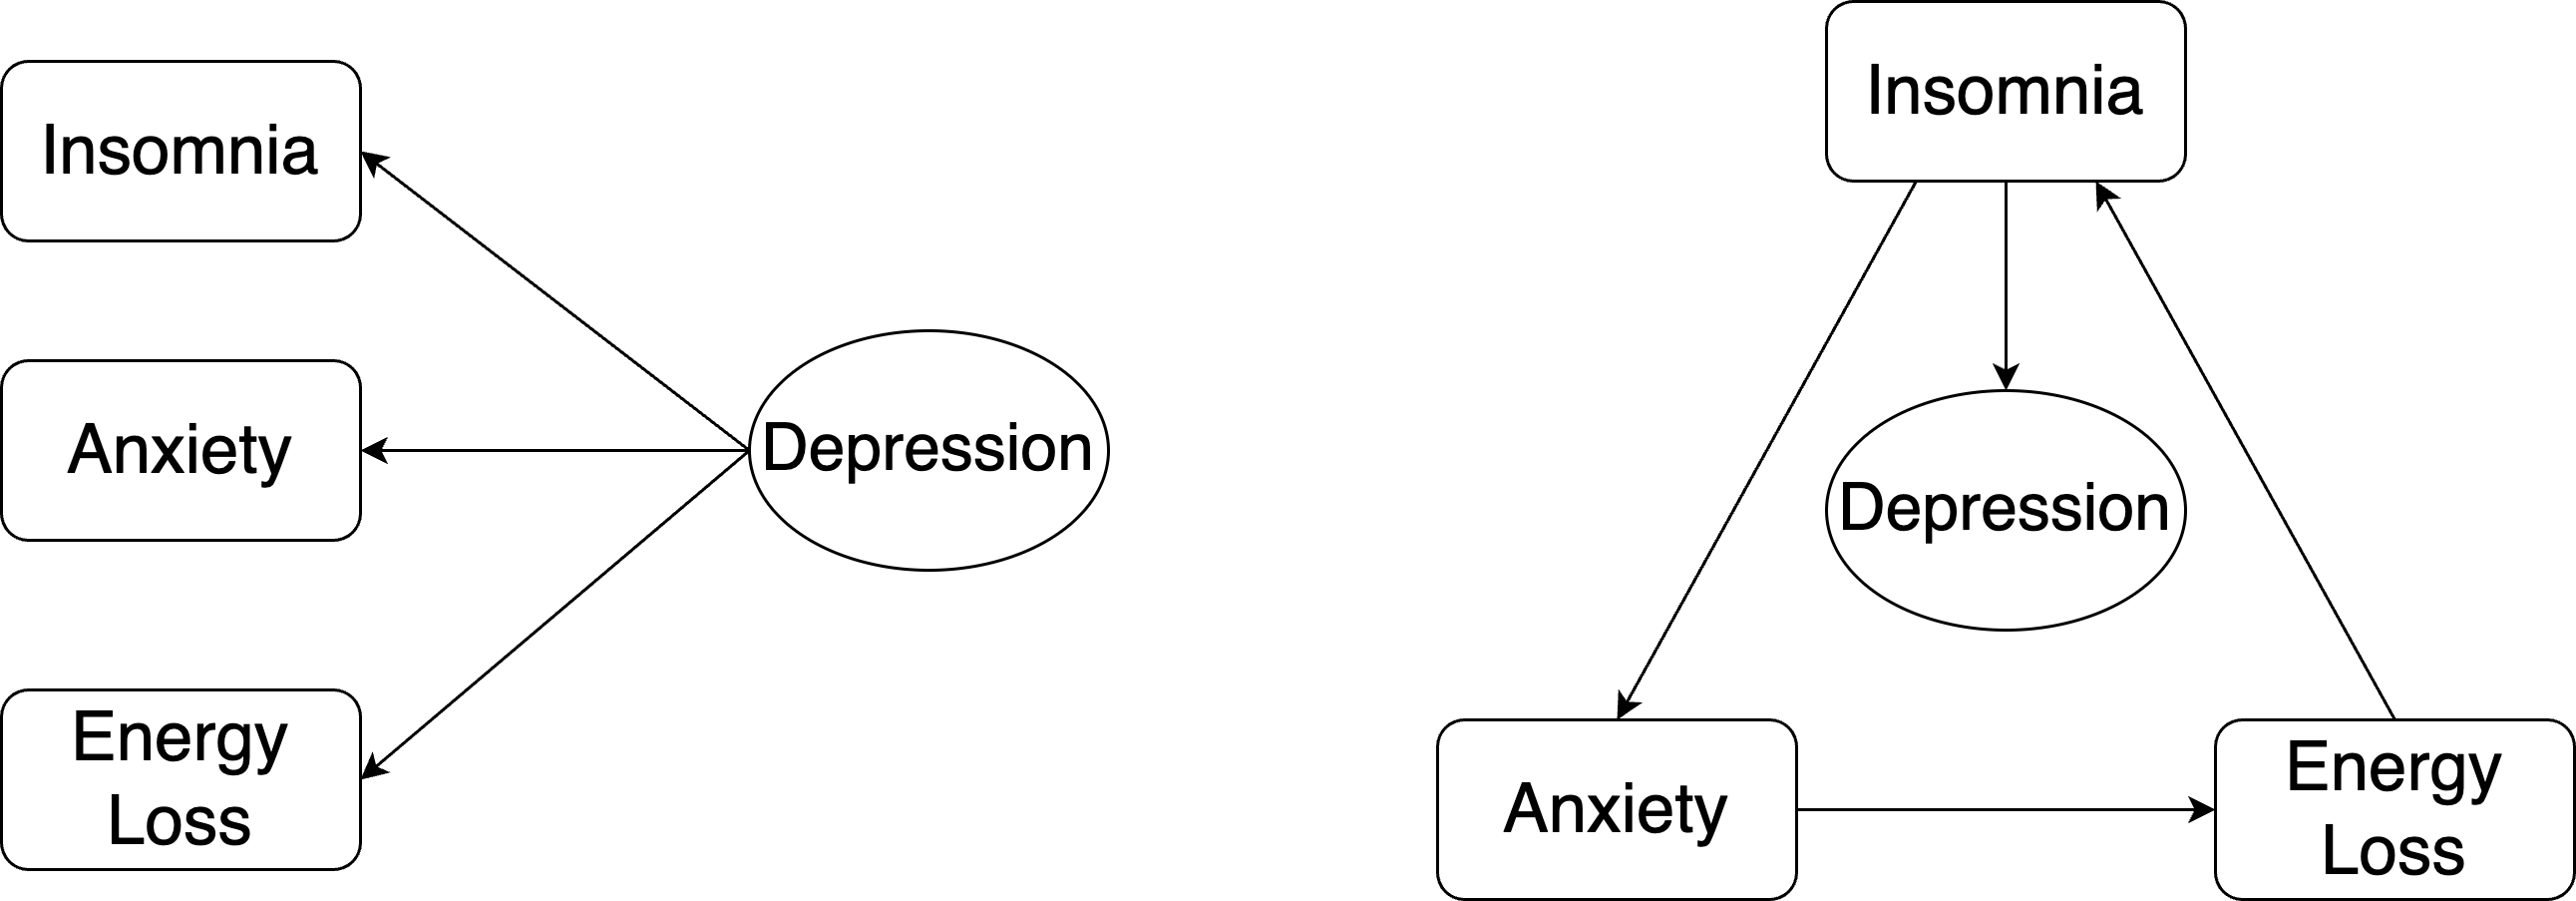
Note: Not all theoretical models can be estimated via statistics
Stanford-Washington University Eating Disorder Screen: Measurement Model is one special type of multivariate model
Research Questions in Multivariate Analysis
- What are the relationships among those variables?
- What are the effects of one variable on the outcomes controlling for other variables?
- How does the model matches the observed data?
- How do we select the best fitting model?
What We Will Cover This Semester
- Part I: General linear models
- Introduction/Descriptive statistics
- Simple, Marginal, Interaction Effects
- Multivariate Linear Models
- Extension: Generalized linear regression
- Predicting non-normal conditional outcomes
- Part II: Statistical techniques
- Normal Distributions and Multivariate Normal Distribution
- Maximum Likelihood Estimation (MLE)
- Matrix algebra for multivariate models
- Part III: Path Analysis
- Structural models
- Part IV: Latent variable models
- Principal component analysis (PCA)
- Exploratory factor analysis (EFA)
- Confirmatory factor analysis (CFA)
- Psychological network analysis
Introduction to R
R is an comprehensive statistical and graphical programming language
We can use R language via multiple graphical user inferences or IDE, i.e., terminal, VS Code or RStudio.
We will mainly focus on RStudio because of its convenience
RStudio is a product of Posit and is free to use for personal use
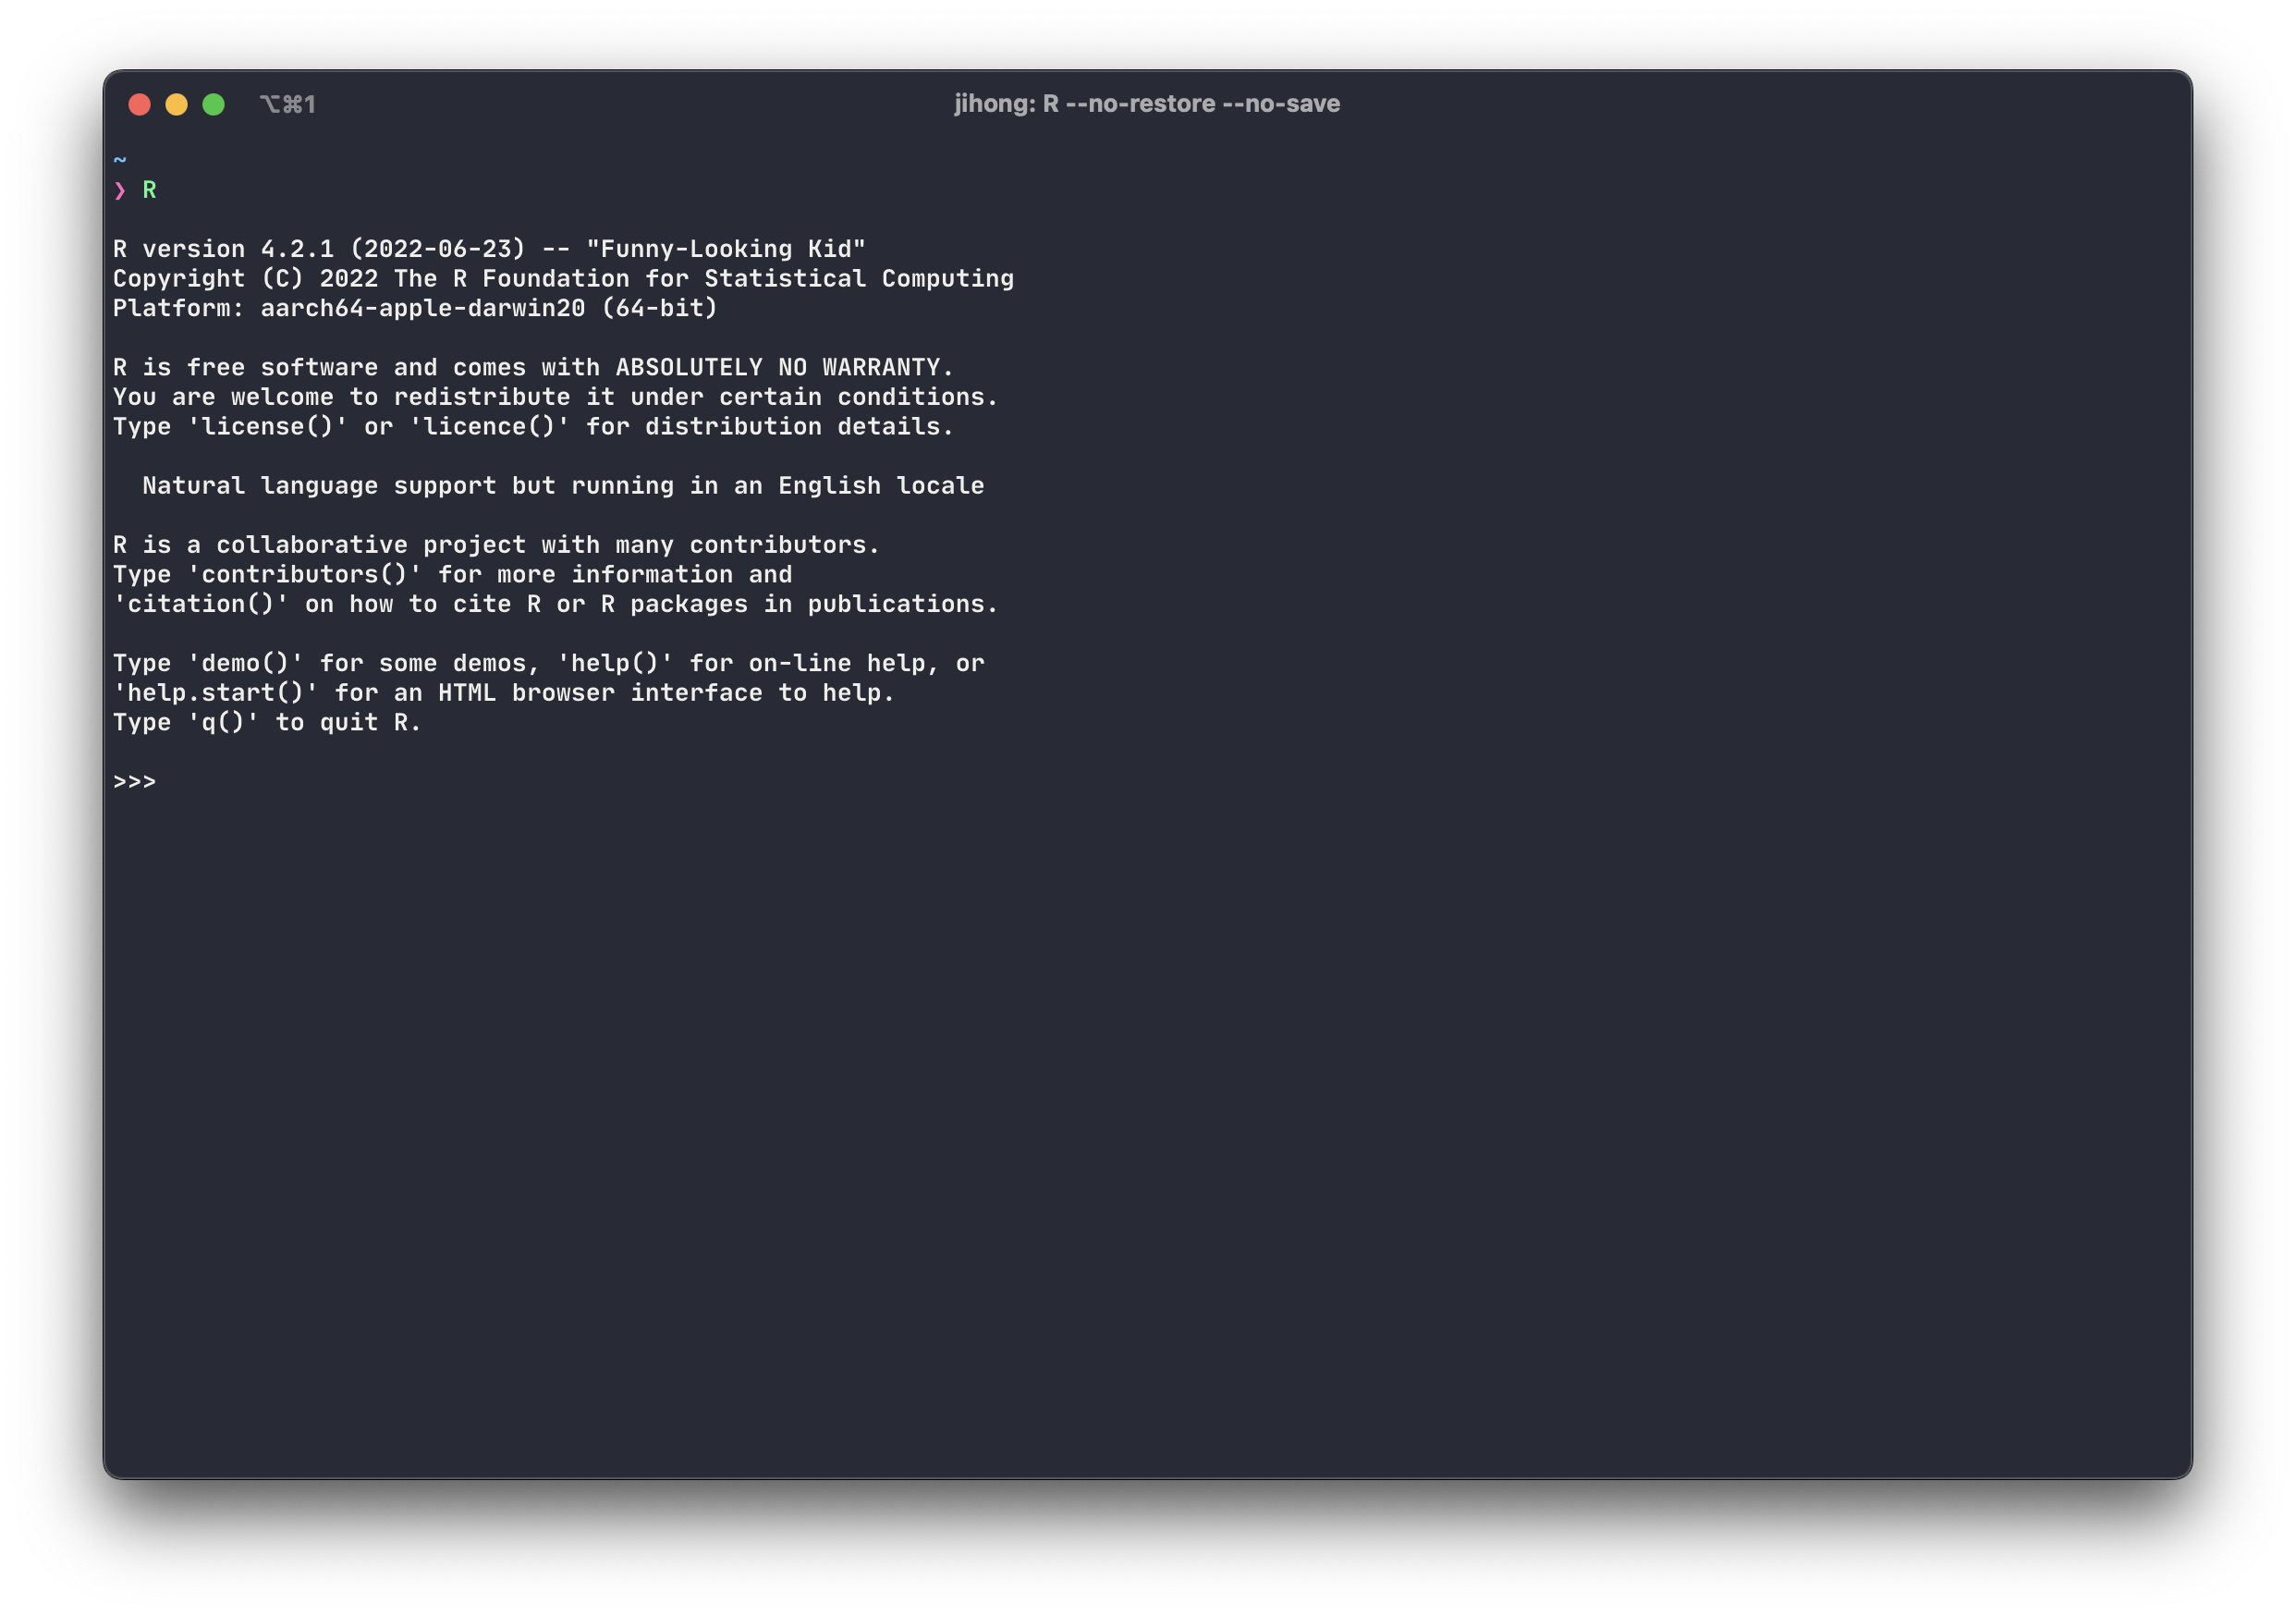
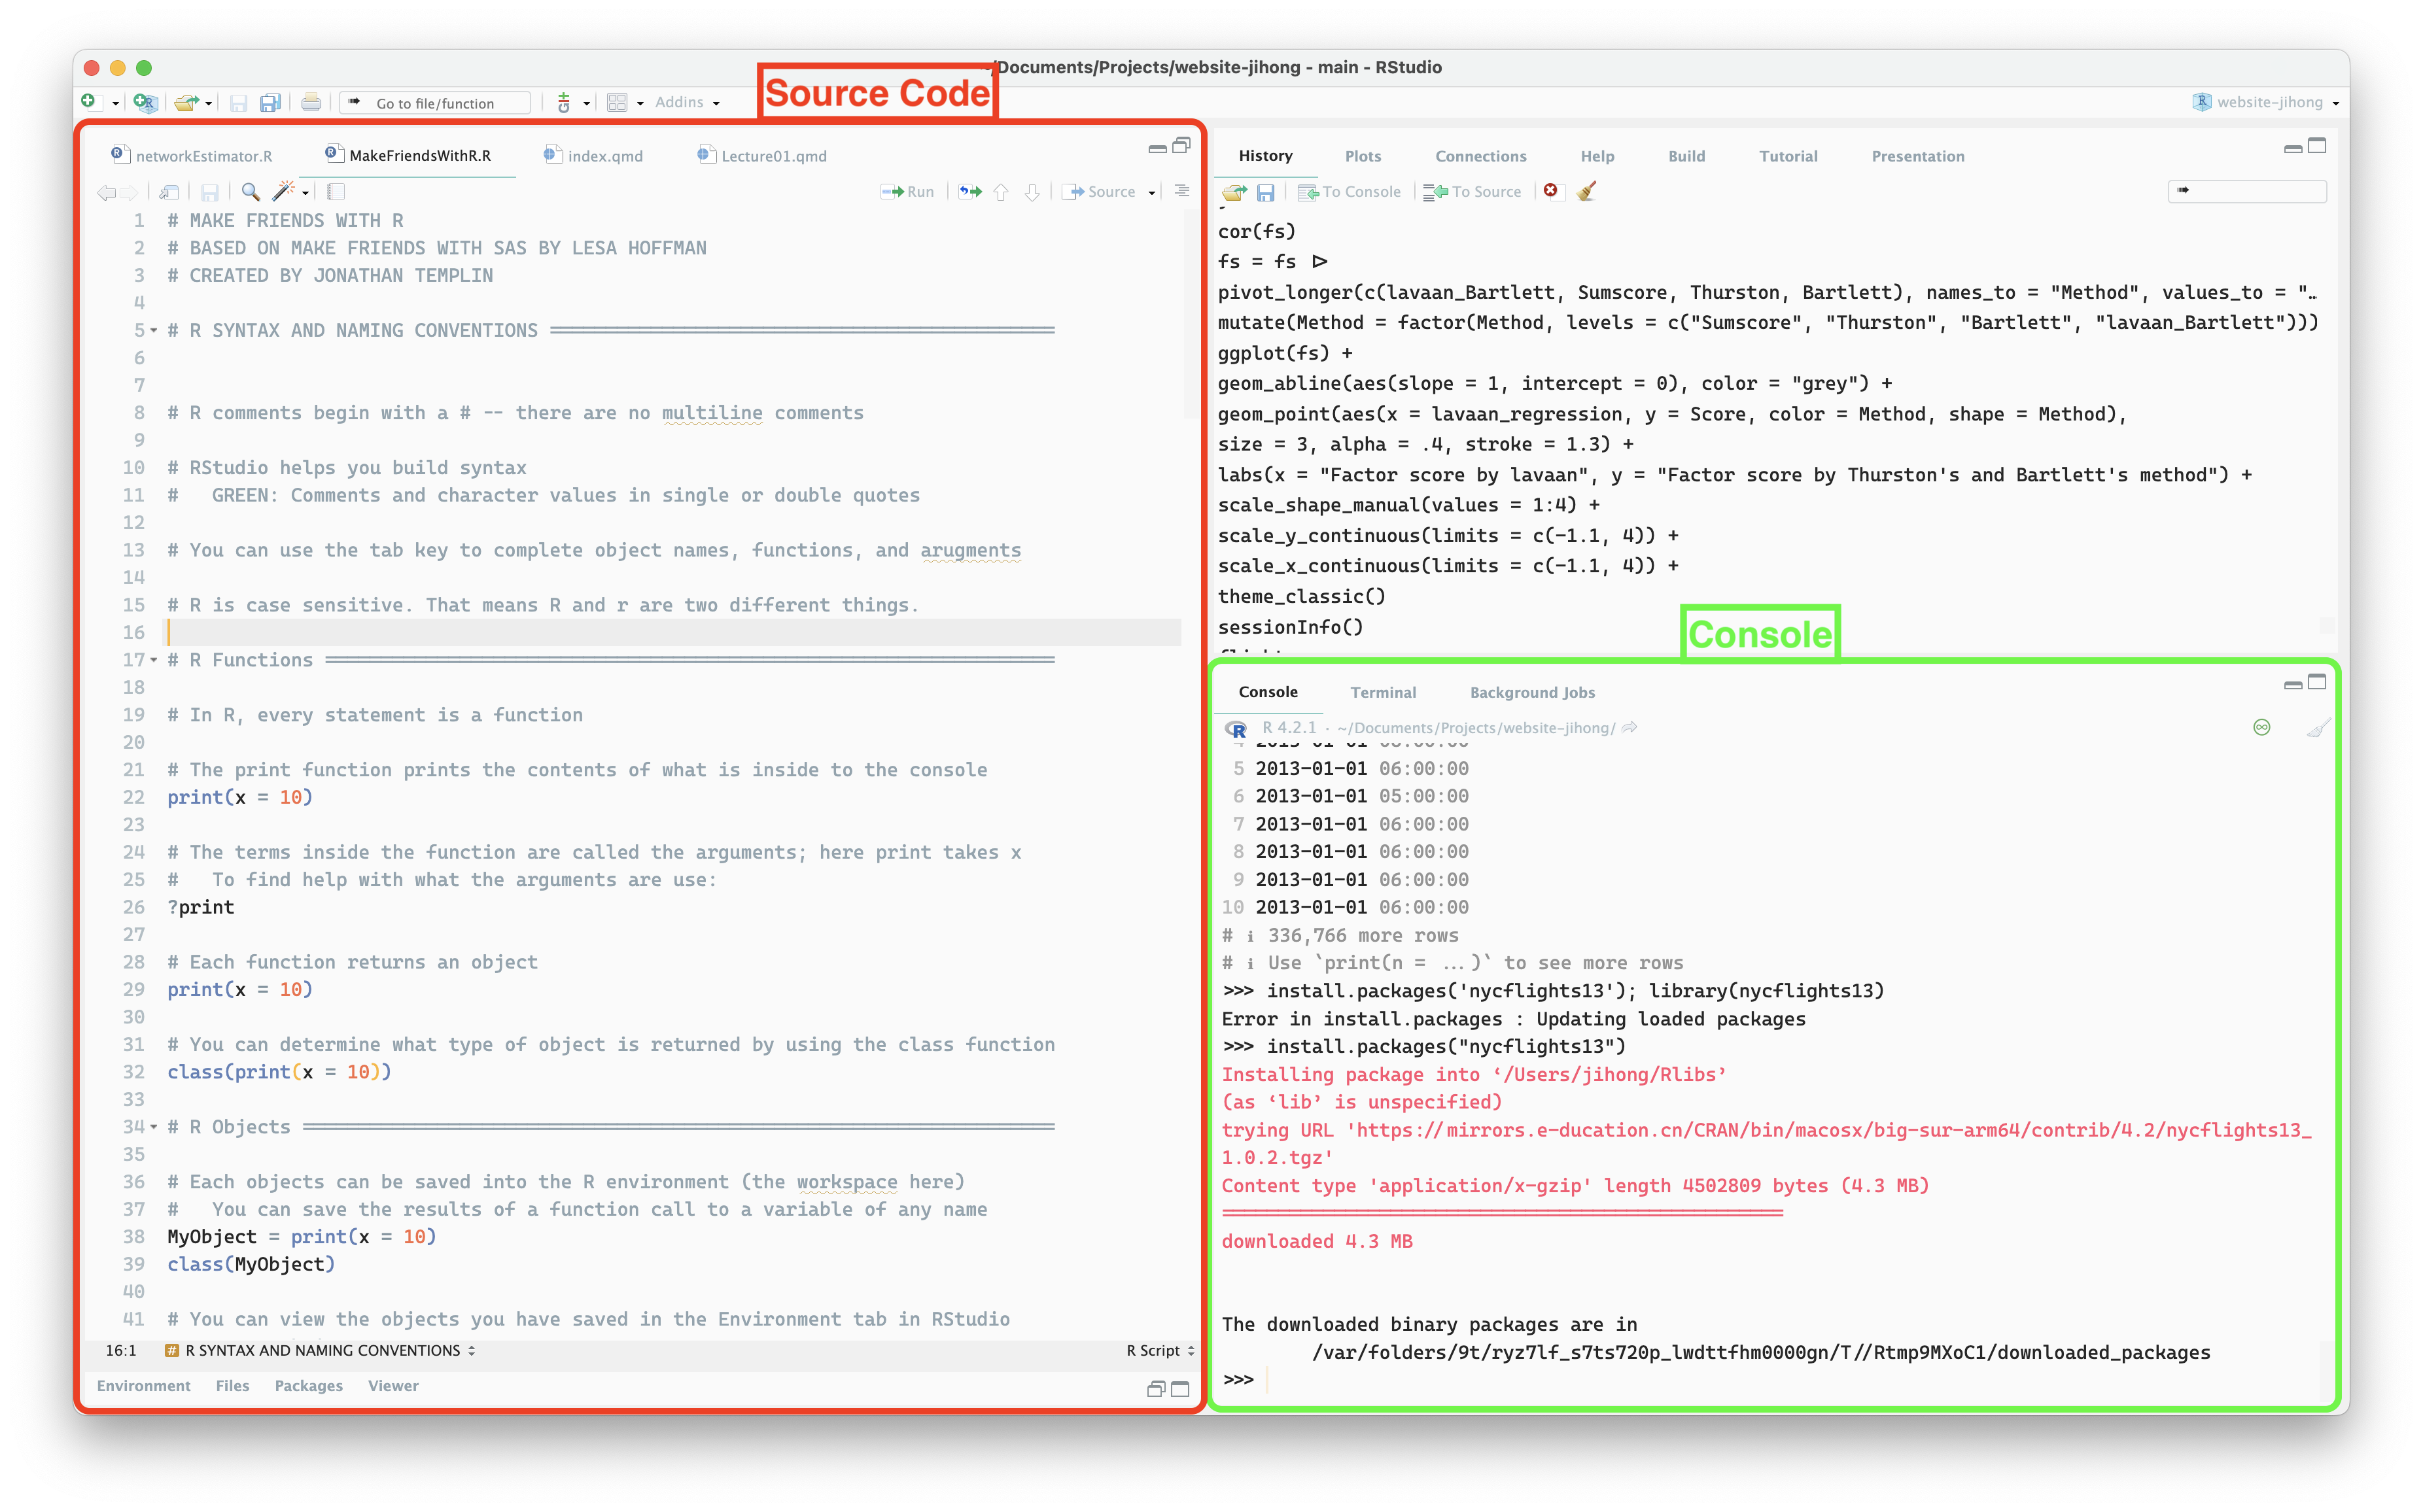
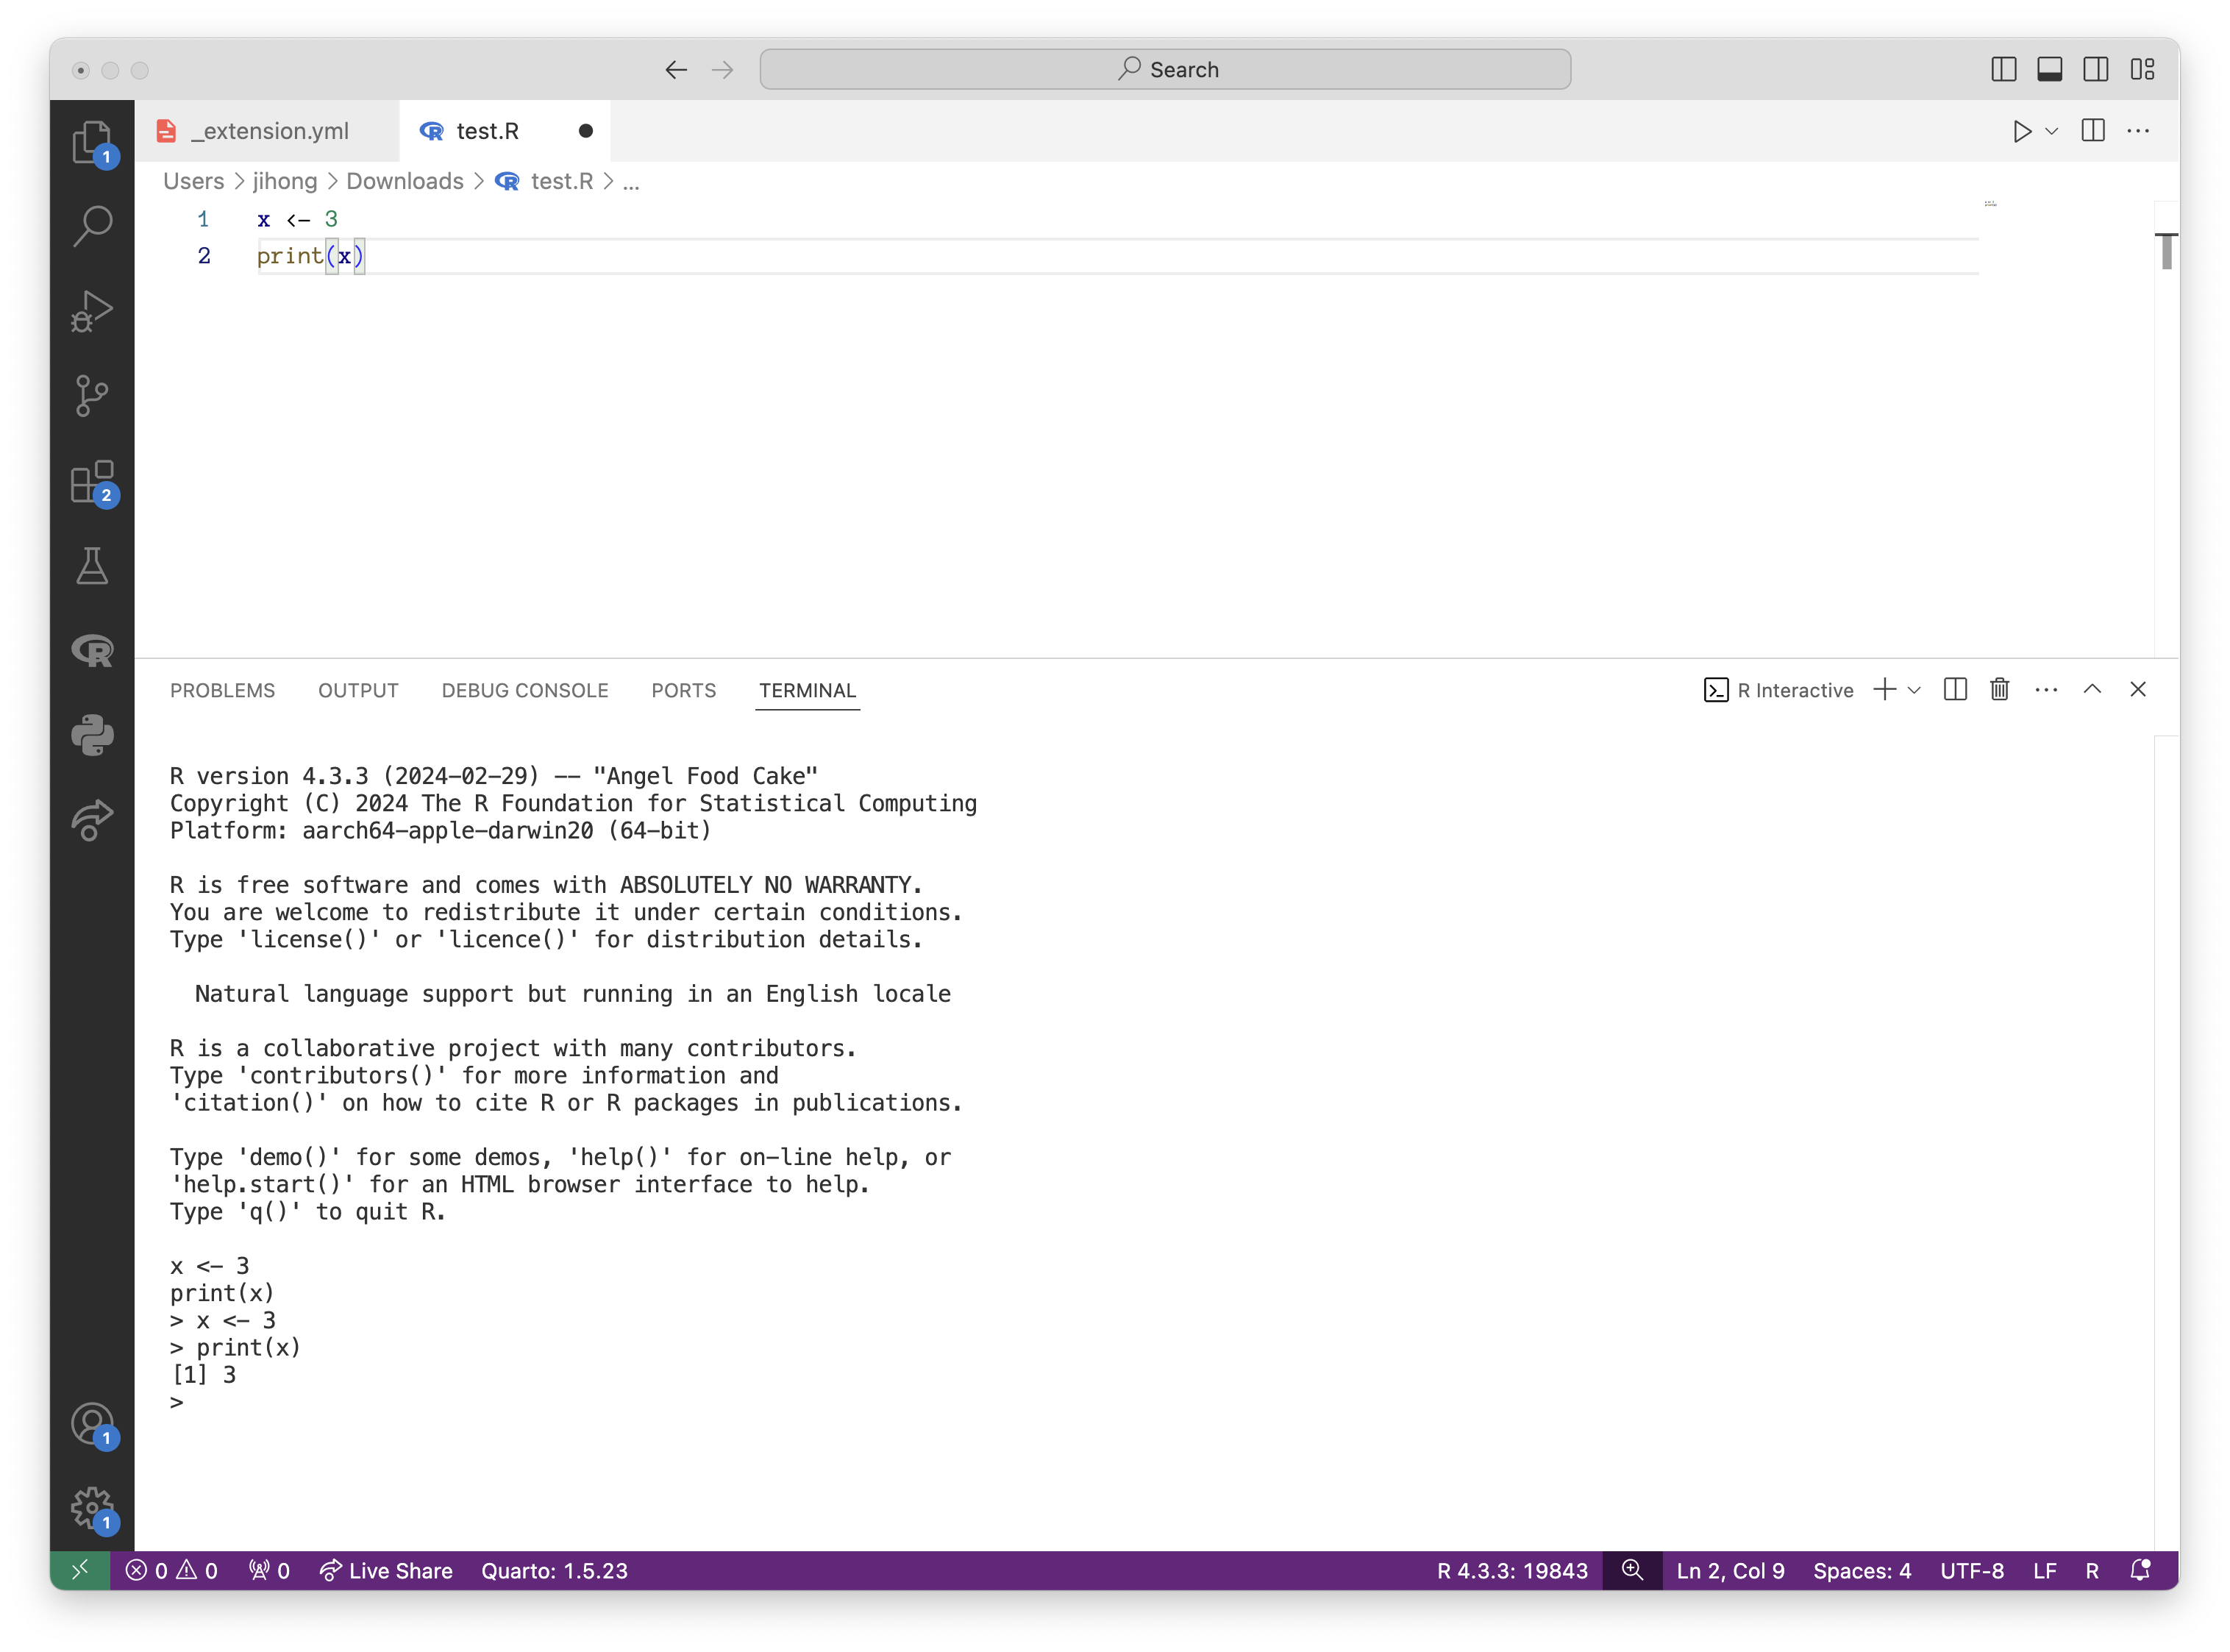
Visual Studio Code
You can review the official article for setting up R in Visual Studio Code.
More RStudio
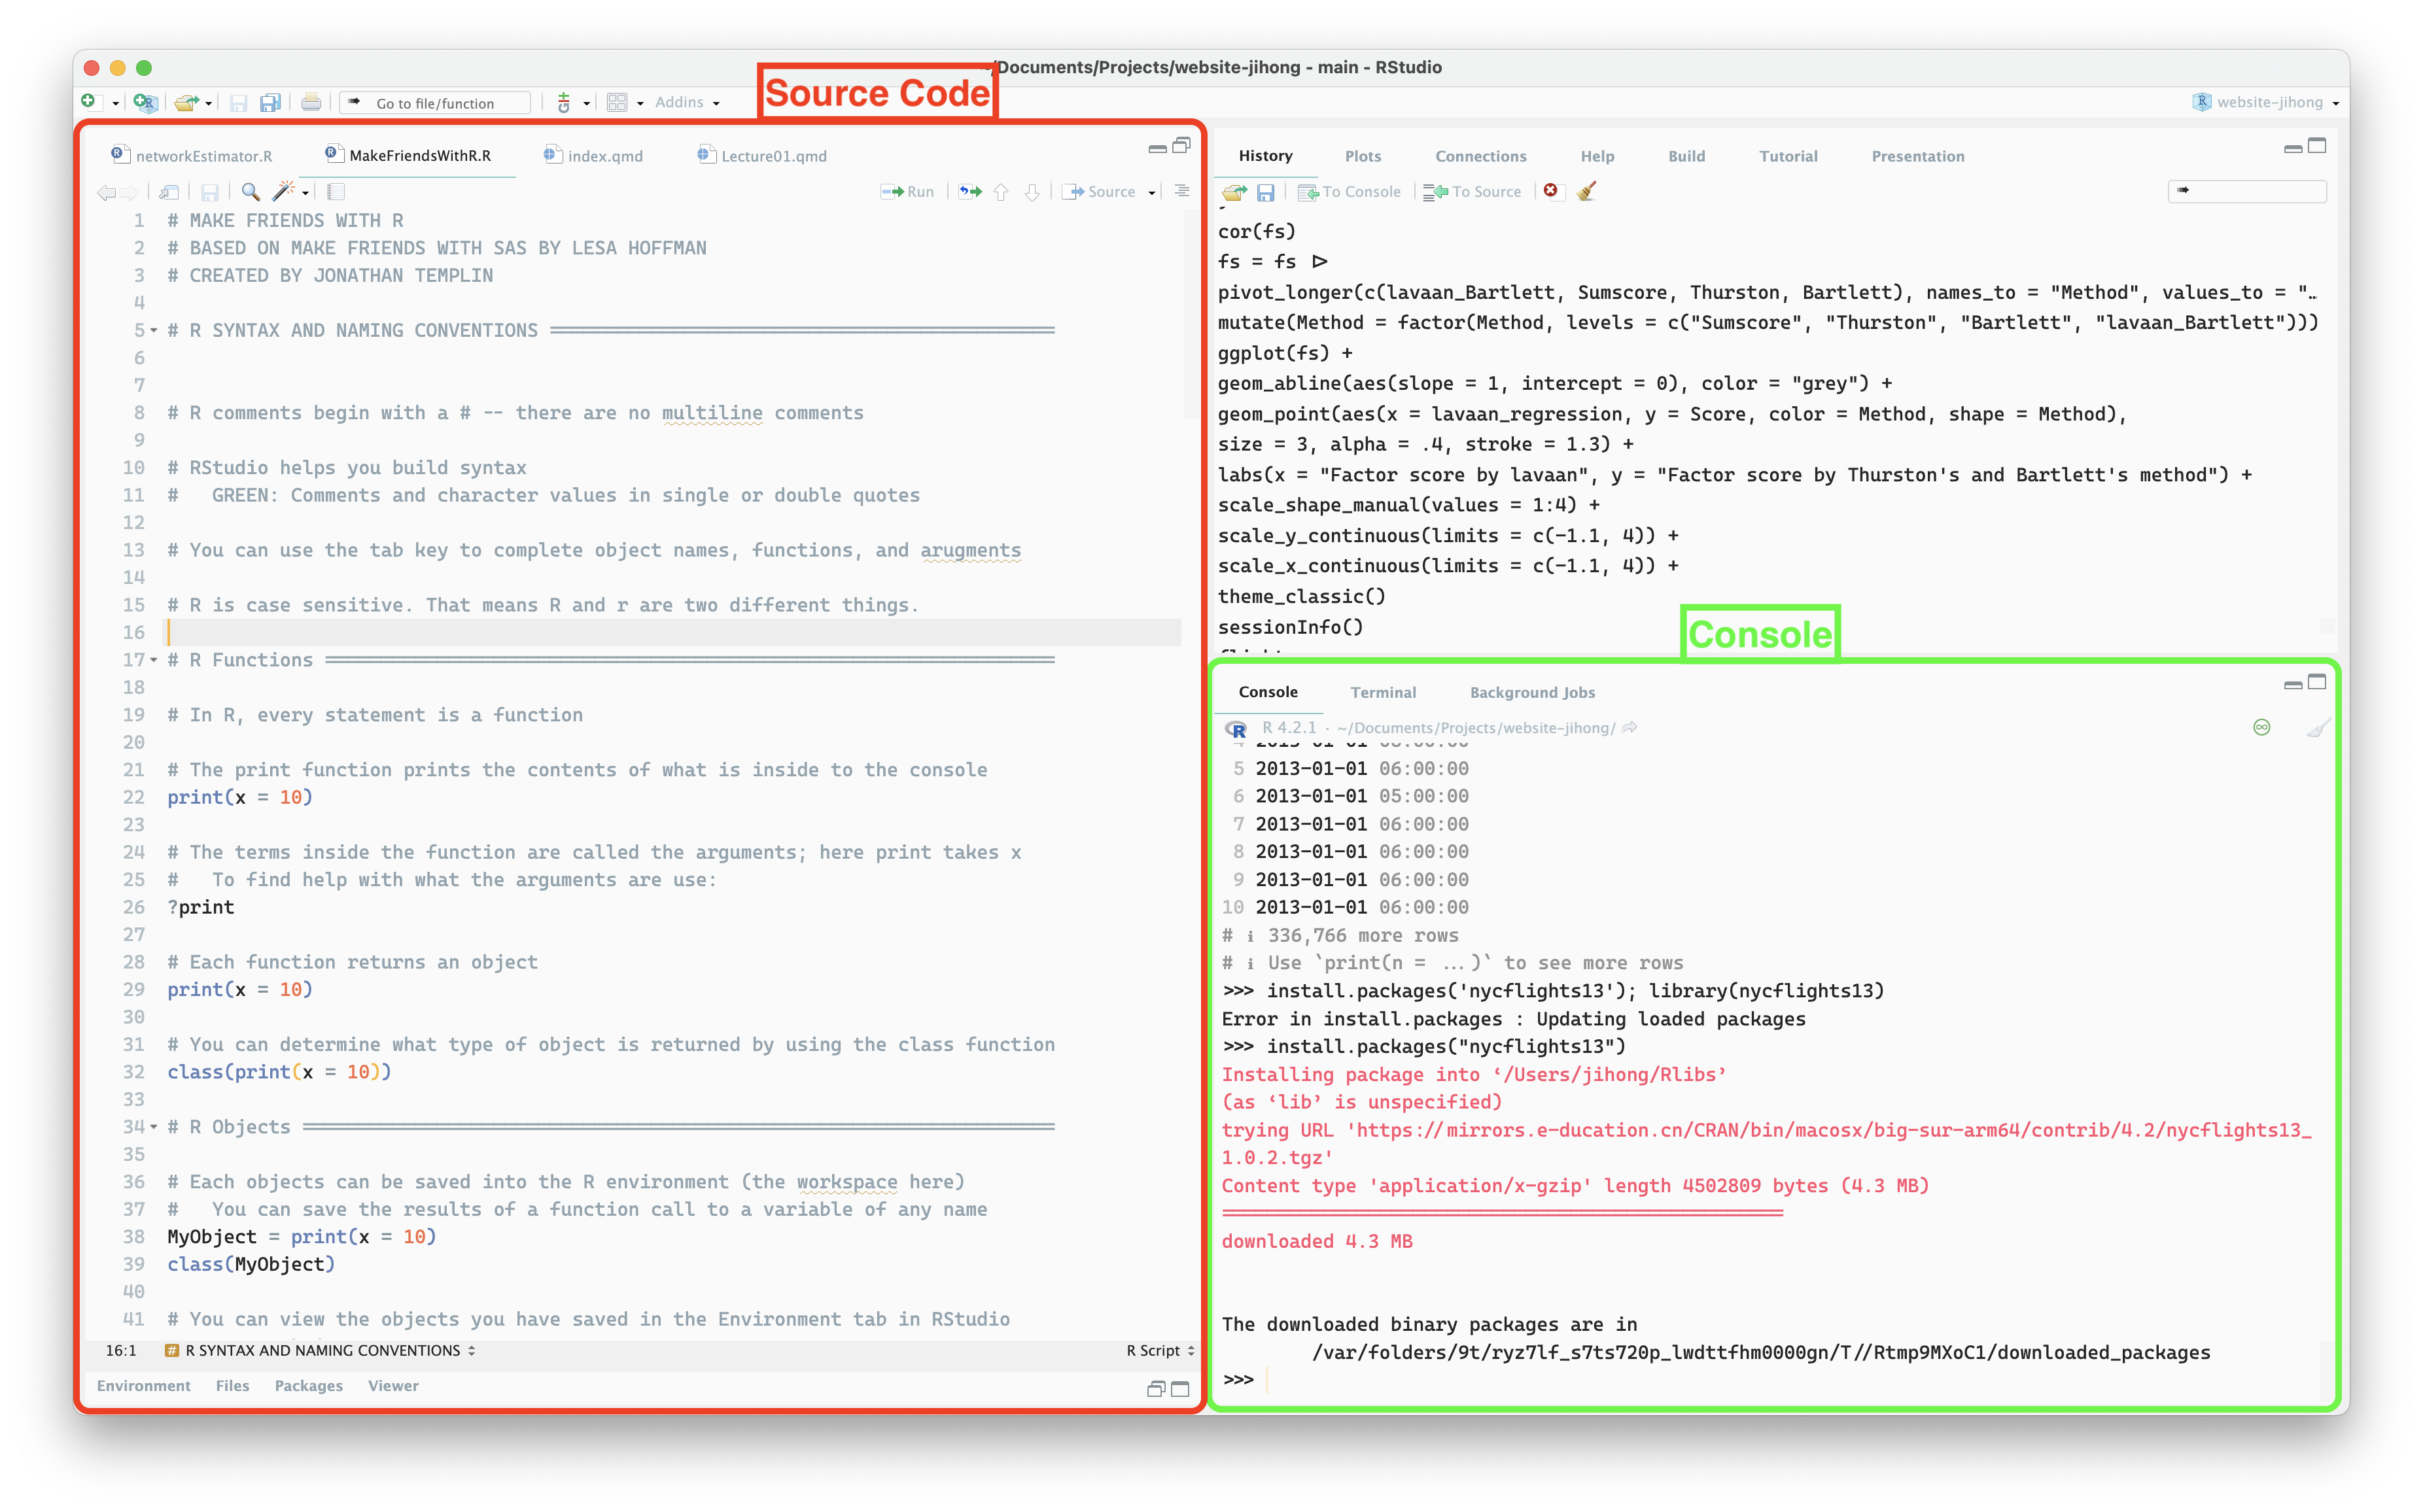
Installation of R and RStudio
You can download and install R base via r-project.org (use the current stable CRAN release; as of Aug. 2026, this is R-4.6.1)
Then, after the installation of R, you can download RStudio via posit.co (currently)
After installation of R and RStudio, you can open up the RStudio to start your R programming.
however, your R only has the base package
To enhance its utility, most users will install R packages for certain purposes
Q&A: R and RStudio Installation
Do I need to install R before RStudio?
- Yes. RStudio is an interface for R; it will not work properly unless R is already installed.
RStudio opens, but it says R cannot be found. What should I do?
- Restart your computer first. If the problem continues, reinstall R from https://cloud.r-project.org/ and then reopen RStudio.
Should I install the newest version of R?
- For this class, the current stable version from CRAN is recommended. Do not worry if your version is slightly different from mine.
Package installation fails. Is RStudio broken?
- Usually not. Check your internet connection, restart RStudio, and try
install.packages("tidyverse")again.
- Usually not. Check your internet connection, restart RStudio, and try
What should I send if I still need help?
- Email me a screenshot that shows the error message, your operating system, and what you already tried.
R packages
R packages are uploaded to some platforms (i.e., CRAN or Github) by researchers or companies
Those R packages typically have their version numbers. Some functions may be available for some version (like Ver. 1.1) but not be available in other versions.
Do not upgrade your packages if you code is running well
R users are free to download and use those R packages
To download certain package, you should know package name
For example, if you want to download the latest version of
tidyversepackage, you can type in following command in the console panel of RStudio
- Or if you want to install the older version of package
require(devtools)
install_version("tidyverse", version = "1.3.0", repos = "http://cran.us.r-project.org")
More about R packages
- CRAN (Comprehensive R Archive Network) is a network of servers around the world that store identical, up-to-date, versions of code and documentation for R.
- It contains most stable version of packages.
- Most of time, we download package from CRAN
- Github is for the fast development for R packages
It contains the up-to-date version of R which may potentially be unstable
You can download the package from Github using
pakpackagepak::pak("tidyverse/ggplot2")You can update the package and its dependencies
pak::pkg_install("ggplot2", upgrade = TRUE)
R functions
To operate certain tasks, you need to use functions contained in R packages
There are two ways of using R functions
Direct way: you don’t have to load your package first
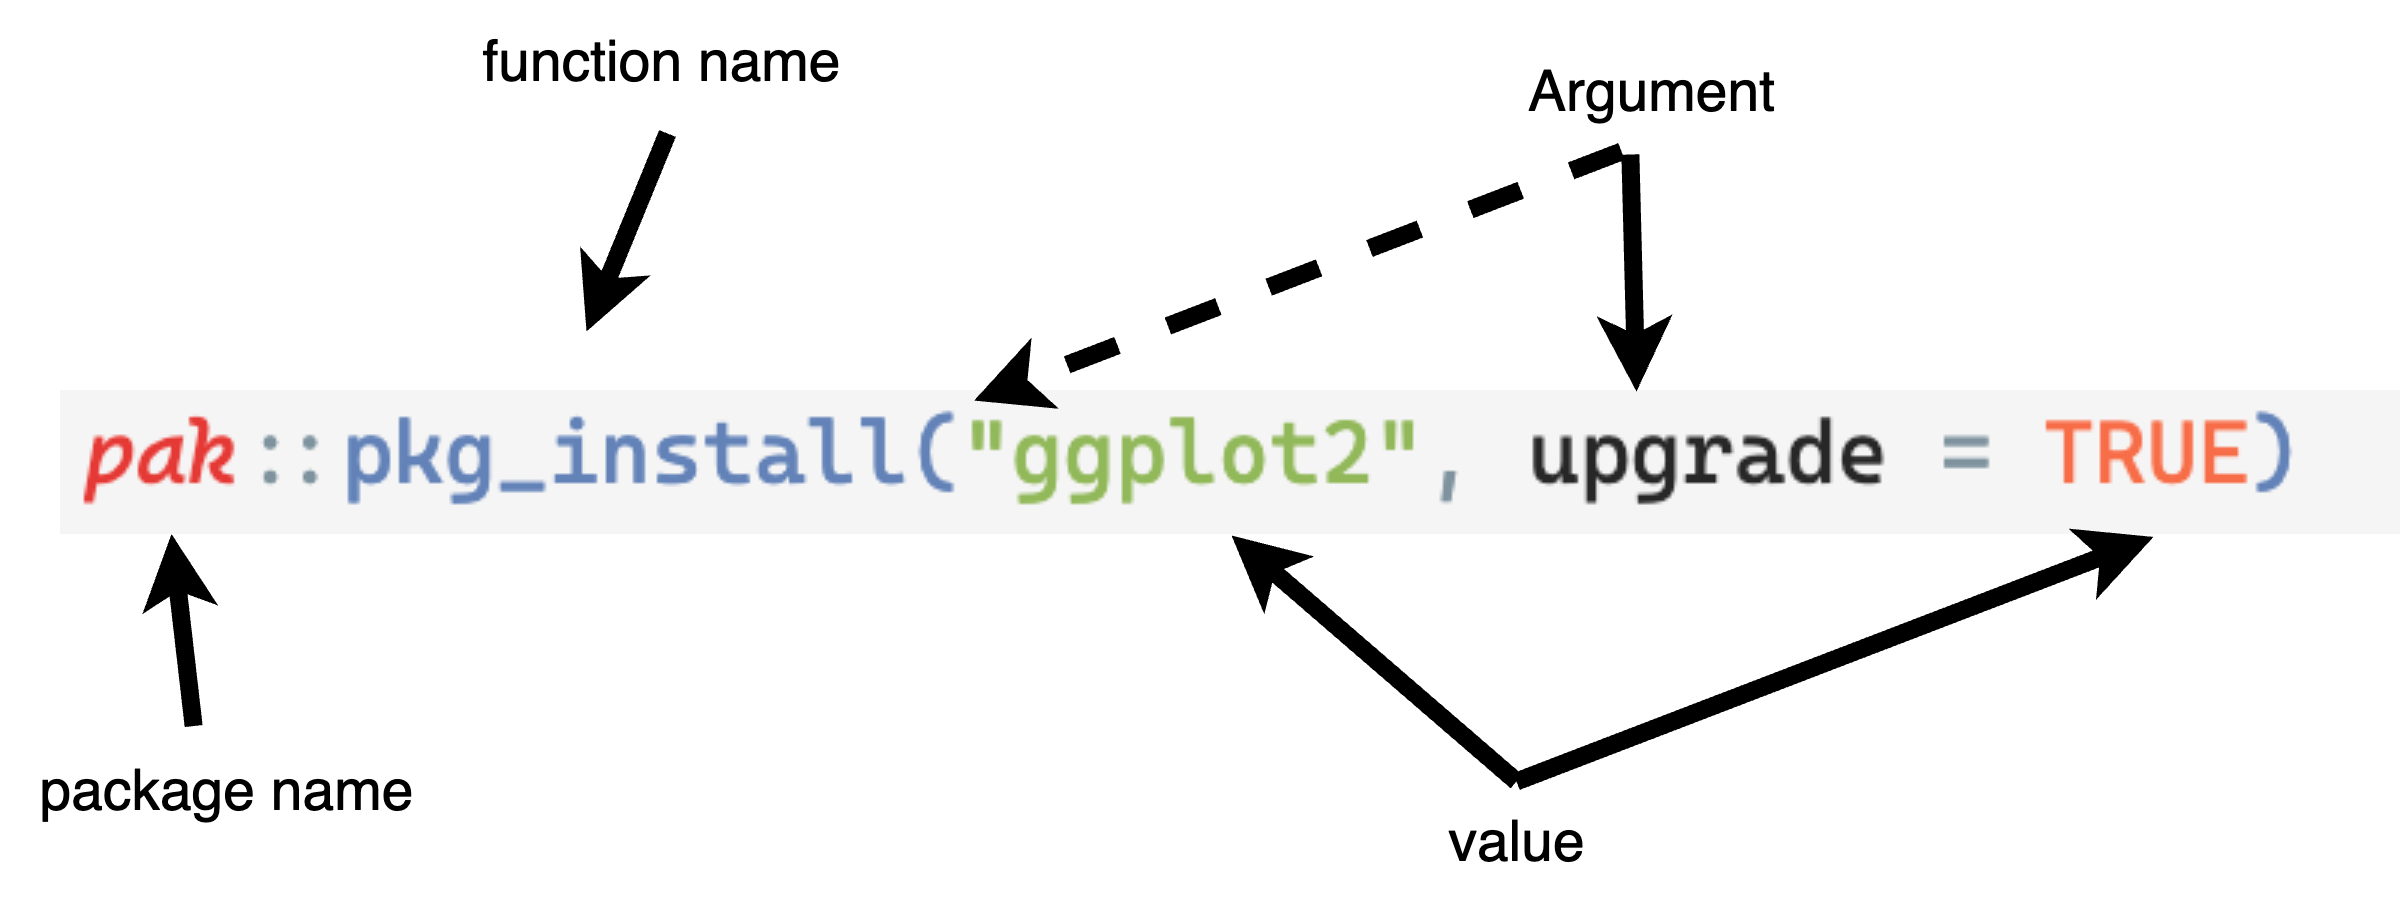
Use-after-load way: Package is loaded in your session before you can call the function name without specifying the package name
require(pak)
pkg_install("ggplot2", upgrade = TRUE)
R functions (Cont.)
How do you know you already load the package or not
You can use
sessionInfofunctionsessionInfo()R version 4.4.3 (2025-02-28) Platform: aarch64-apple-darwin20 Running under: macOS 26.3.1 Matrix products: default BLAS: /Library/Frameworks/R.framework/Versions/4.4-arm64/Resources/lib/libRblas.0.dylib LAPACK: /Library/Frameworks/R.framework/Versions/4.4-arm64/Resources/lib/libRlapack.dylib; LAPACK version 3.12.0 locale: [1] en_US.UTF-8/en_US.UTF-8/en_US.UTF-8/C/en_US.UTF-8/en_US.UTF-8 time zone: America/Chicago tzcode source: internal attached base packages: [1] stats graphics grDevices utils datasets methods base other attached packages: [1] cmdstanr_0.9.0 rstan_2.32.7 StanHeaders_2.32.10 loaded via a namespace (and not attached): [1] tensorA_0.36.2.1 generics_0.1.3 digest_0.6.37 [4] magrittr_2.0.3 evaluate_1.0.3 grid_4.4.3 [7] fastmap_1.2.0 jsonlite_2.0.0 processx_3.8.6 [10] pkgbuild_1.4.7 backports_1.5.0 ps_1.9.0 [13] gridExtra_2.3 QuickJSR_1.7.0 scales_1.3.0 [16] codetools_0.2-20 abind_1.4-8 cli_3.6.5 [19] rlang_1.1.7 munsell_0.5.1 yaml_2.3.10 [22] tools_4.4.3 inline_0.3.21 parallel_4.4.3 [25] checkmate_2.3.2 dplyr_1.2.0 colorspace_2.1-1 [28] ggplot2_3.5.2 curl_6.4.0 vctrs_0.7.1 [31] posterior_1.6.1 R6_2.6.1 matrixStats_1.5.0 [34] stats4_4.4.3 lifecycle_1.0.5 htmlwidgets_1.6.4 [37] V8_6.0.3 pkgconfig_2.0.3 RcppParallel_5.1.10 [40] pillar_1.10.2 gtable_0.3.6 loo_2.8.0 [43] glue_1.8.0 Rcpp_1.0.14 xfun_0.52 [46] tibble_3.2.1 tidyselect_1.2.1 knitr_1.50 [49] htmltools_0.5.8.1 rmarkdown_2.29 compiler_4.4.3 [52] distributional_0.5.0It outputs multiple info:
R version, Operations System, Matrix operation package, Locale
Attached packages (you can call the functions of those package)
Loaded package via a namespace (and not attached), which you cannot call functions and need to
libraryorrequirethem
Run R code
After you finish R script, you have multiple ways of running the code:
Method 1: you can click
Runbutton in the top right-head of RStudioMethod 2: you can select certain code and press
Ctrl + Enter(Win) orCommand + Return(Mac)Method 3: you can
Rscript [FILENAME].rto run the whole scriptMethod 4: you can using R notebook to interactively run R code
| Script file is .R | Script file is .rmd or .qmd | |
|---|---|---|
| Run the whole script |
|
|
| Run the partial script |
|
|
Example 1: Homework Portal
Homework online portal will be delivered on the website
The homework system is based on Microsoft Form. You can answer the questions via Laptop, PC or Mobile Phone.
- Make sure your device connect to the Internet.
Let me use Homework 0 as one example.
Summary
- Note that the syllabus, schedule, and all materials are uploaded online the week before class.
- We learn that R, RStudio, and Quarto (.qmd) can be used to execute R code/syntax.
- In-class quizzes may be administered at the beginning of class. They should be quick and low-stress.
- Office hour will be 2PM - 4PM on Monday. Feel free to stop by my office and ask questions.
- Next week, we will continue the introduction and discuss statistics in the AI era.
Next Week
We will:
- Practice R coding using MakeFriendsWithR.qmd
- Continue the introduction with statistics in the AI era
- HW0 will be due on 08/31, when we begin descriptive statistics and the general linear model