A Multi-Agent Large Language Model Framework for Automated Q-Matrix Generation

AERA 2026 Annual Meeting

Jihong Zhang, Ph.D.; Xinya Liang, Ph.D.

Department of Counseling, Leadership, and Research Methods

University of Arkansas

2026-04-01

1 Introduction

Motivation

  • Q-matrix construction and validation is expert-intensive, time-consuming, and subjective
  • Requires multiple evidence sources: student think-aloud protocols, expert ratings, psychometric considerations (Li & Suen, 2013)
  • Real human data can be scarce or low-quality in early test development
  • Traditional procedures are susceptible to human bias or error

AI-driven automation can improve efficiency, consistency, and scalability

Q-Matrix Construction

  • Q-matrix specifies item-attribute relationships in DCMs (Tatsuoka, 1983)
  • Traditional construction (Buck & Tatsuoka, 1998): define attributes \(\rightarrow\) code Q-matrix \(\rightarrow\) estimate parameters \(\rightarrow\) refine iteratively
  • Expert-intensive, time-consuming, and prone to subjectivity
  • Misspecification \(\rightarrow\) poor model fit and incorrect classification
\(\alpha_1\) \(\alpha_2\) \(\alpha_3\)
Item 1 1 0 0
Item 2 0 1 0
Item 3 1 1 0
Item 4 0 1 1

LLMs for Q-Matrix Construction

  • Single-agent approaches: Prior work uses a single LLM to perform one task at a time — e.g., automated scoring, item generation, Q-matrix drafting (Asiret et al., 2025)
  • Limitation: Content-based generation and data-driven validation are applied separately, requiring human intervention to bridge them
  • Multi-agent approach (this study): Assigns distinct roles (domain expert, psychometrician, researcher) to specialized agents that collaborate across phases
  • Advantage: Seamlessly integrates LLM generation, statistical validation, and judgment-based finalization in a single pipeline

2 Research Questions

Research Questions

RQ1: What is the stability of Q-matrices generated and validated by the multi-agent framework across repeated runs?

RQ2: What are the overlap rates between the multi-agent-produced Q-matrices and the reference Q-matrix?

RQ3: How do different finalization strategies within the multi-agent framework affect the overlap rate between the final Q-matrix and the reference Q-matrix?

3 Method

Multi-Agent Framework
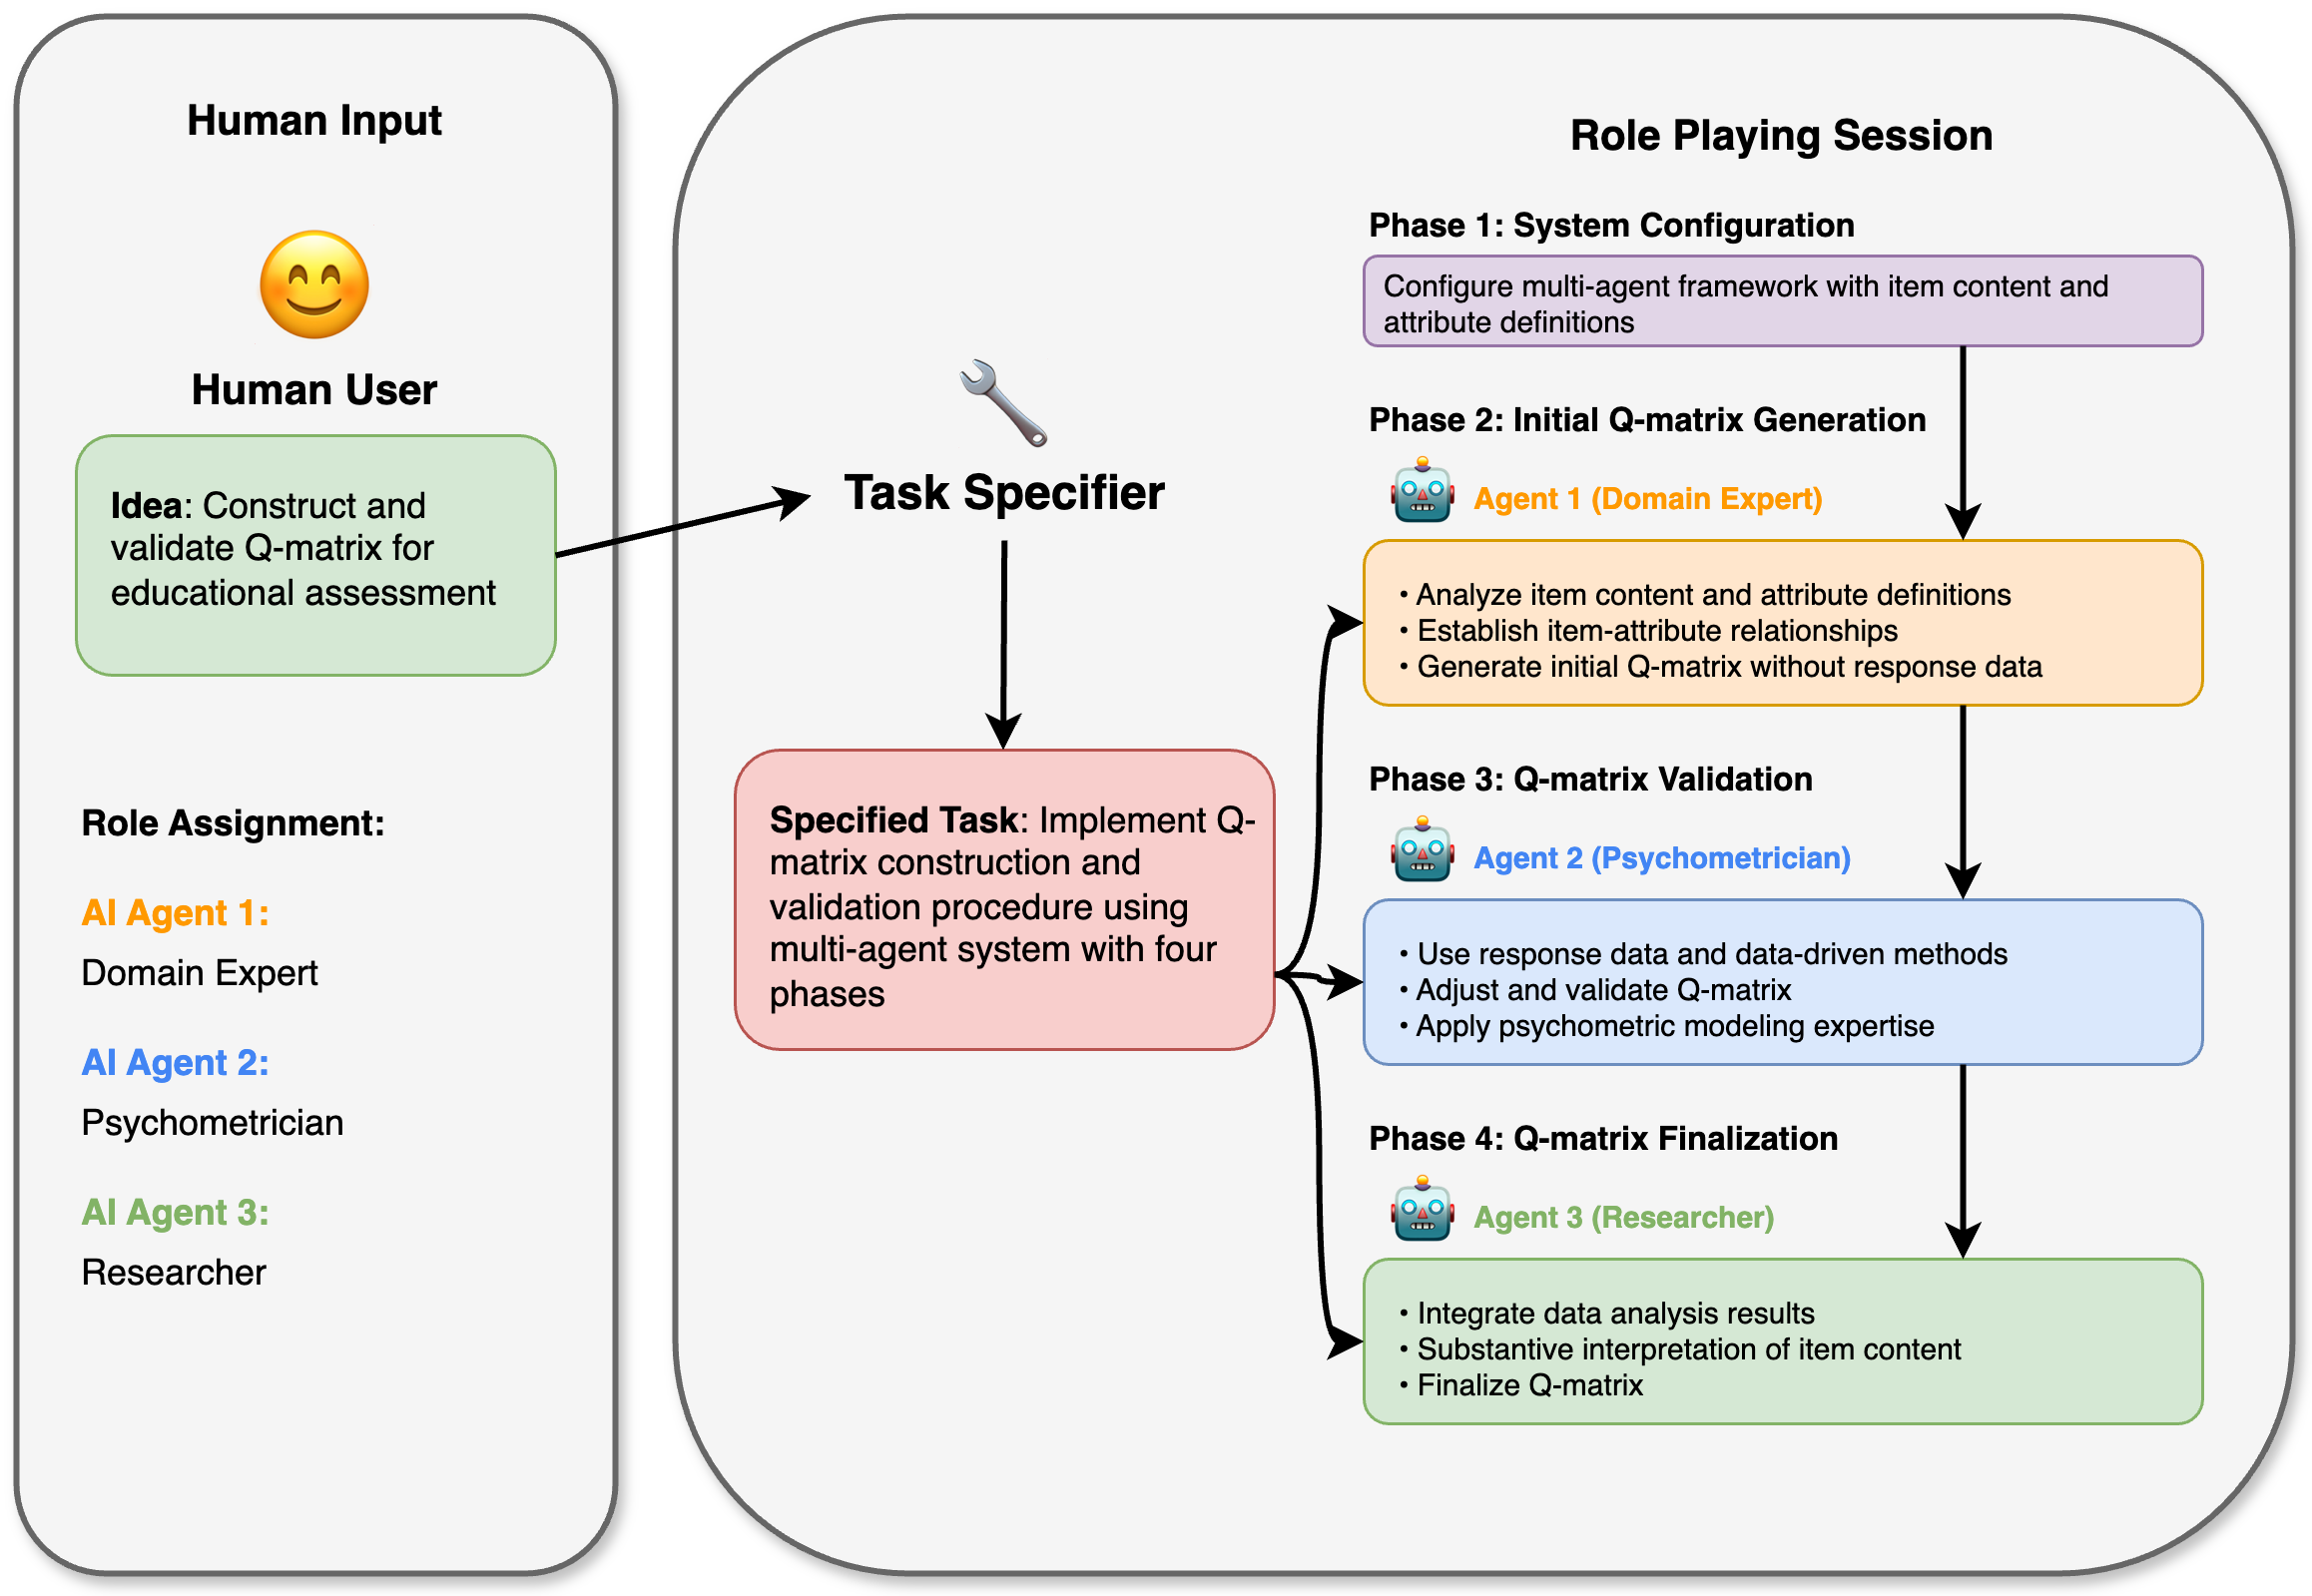
Q-matrix Construction Role-Playing Framework
Phase Agent Output
Generation Domain Expert \(Q_0\) from item content
Validation Psychometrician \(Q_1\) via GDINA/Qval
Finalization Researcher \(Q_{final}\) integrating \(Q_0\) + \(Q_1\)

Four Finalization Strategies

Plan Phase 2 Phase 3 Phase 4 Binarization
A 1 \(Q_0\) 1 \(Q_1\) 1 \(Q_{final}\) AI agent reviews \(Q_0\) and \(Q_1\)
B 100 \(Q_0\) 100 \(Q_1\) 1 \(Q_{final}\) AI agent reviews \(\hat{P}_{Q_0}\) and \(\hat{P}_{Q_1}\)
C 100 \(Q_0\) 100 \(Q_1\) 1 \(Q_{final}\) Researcher cutoff on \(\hat{P}_{Q_1}\)
D 100 \(Q_0\) 100 \(Q_1\) 100 \(Q_{final}\) AI agent reviews \(\hat{P}_{Q_{final}}\)
  • Plans B–D use 100 replications to quantify stochastic variability
  • Plan A minimizes computational cost but does not capture LLM generation variability

Technical Stack & Prompt Design

  • LLM: Llama-3.1 (70b-instruct)
  • Framework: NVIDIA NeMo Agent Toolkit
  • Languages: Python, R
  • Psychometric Package: GDINA, Qval (R)
  • Validation: PVAF
Agent 1 (Domain Expert — Generation)
Assign [J] items to [K] attributes based solely on item content and definitions. Output: {"q_matrix": {"A1": [items], ..}}
Agent 2 (Psychometrician — Validation)
Compare initial \(Q_0\) against data-driven alternative. Tools: GDINA() \(\rightarrow\) fit DCM; Qval() \(\rightarrow\) PVAF validation. Output: “Old_Matrix” or “New_Matrix”
Agent 3 (Researcher — Finalization)
Integrate \(Q_0\), \(Q_1\), item content, and parameter estimates. Rules: (1) Screen agreement between \(Q_0\) and \(Q_1\); (2) Evaluate cross-loading by content + data; (3) Apply structural constraints. Output: {"q_matrix": {"A1": [items], ..}}

4 Study 1: Social Anxiety Disorder Scale

Study 1: Measurement

  • SAD Scale: 13-item survey measuring social phobia (Iza et al., 2014)
  • 7-point Likert scale; 3 attributes:
    • A1: Public Performance
    • A2: Close Scrutiny
    • A3: Interaction
  • Simulated data (N = 787) from CDM R package
  • Two reference Q-matrices: \(Q_1^*\) (content-based) and \(Q_2^*\) (data-validated)

Evaluation metric: Overlap Rate (OR) = proportion of matched q-entries between two Q-matrices, computed at overall, attribute, and item levels.

Study 1: Stability of Q-Matrices

Initial Q-matrix Variability

Validated Q-matrix Variability
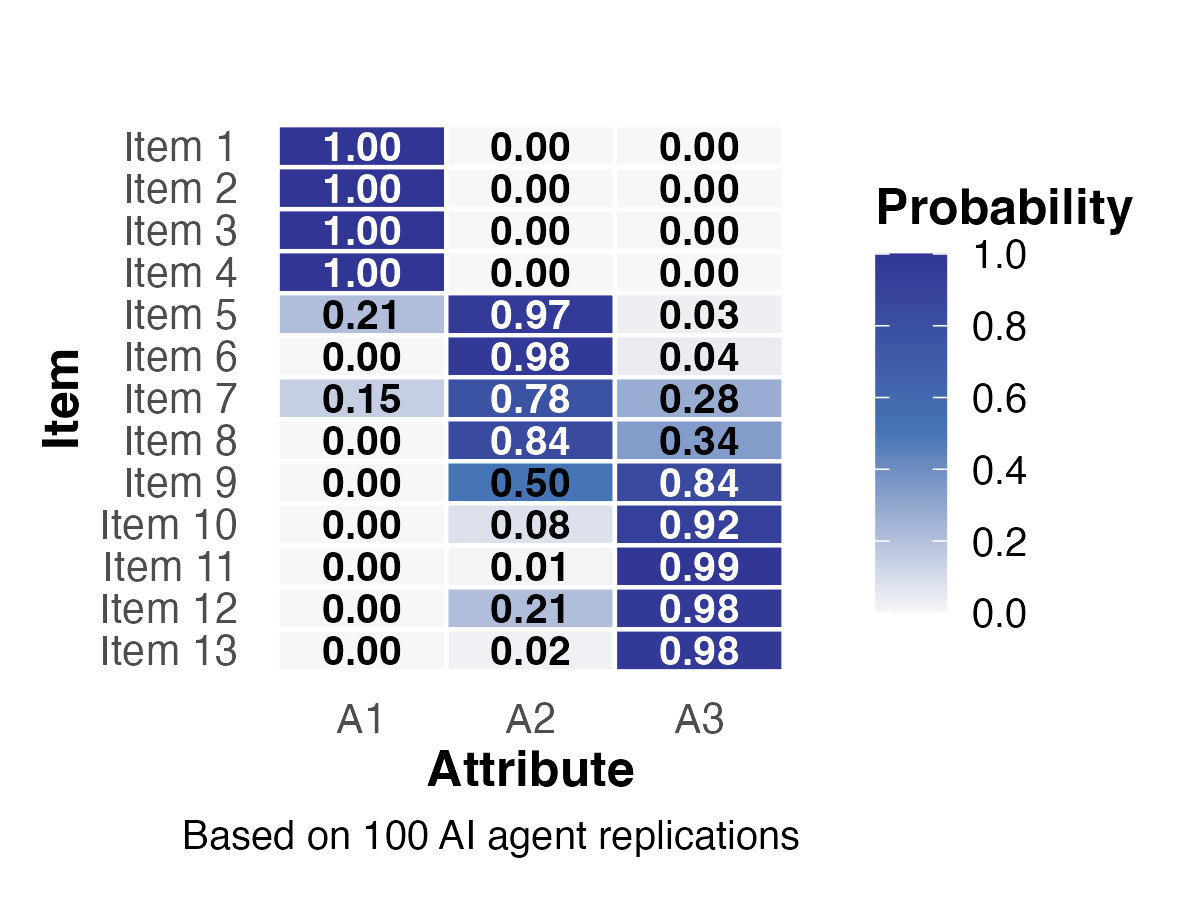
  • Items 1–4 (A1) and 10–13 (A3): high certainty (\(p \approx 1.0\))
  • Items 7–9 (A2): greater uncertainty, mixed patterns
  • Validated Q-matrices showed reduced variability after data-driven validation

Study 1: Overlap Rates

Initial Q-matrix vs. \(Q_1^*\): Overall OR = 0.90 (95% CI [0.89, 0.92])

  • A1: 0.97 | A2: 0.87 | A3: 0.86

Validated Q-matrix vs. \(Q_2^*\): Overall OR = 0.77 (95% CI [0.76, 0.78])

  • A1: 0.97 | A2: 0.55 | A3: 0.79
  • A2 (close scrutiny) showed the lowest overlap — consistent with its lowest factor loading (0.62) in prior research

Study 1: Final Q-Matrix Results

Overlap rates across four finalization plans
  • Plans B, C (OR = 0.77) > Plan D (0.67) > Plan A (0.62)
  • A1 (public performance): consistently highest overlap across all plans
  • A2 (close scrutiny): consistently lowest — ambiguous construct boundaries
  • Item 4 had lowest item-level OR (0.33) across all plans
  • Items 7–9 showed inconsistent patterns across finalization strategies

5 Study 2: Fraction Subtraction Test

Study 2: Measurement

  • Fraction subtraction dataset (Tatsuoka, 1990; de la Torre, 2008)
  • 12 items, N = 536 middle school students
  • 4 attributes:
    • A1: Basic fraction subtraction
    • A2: Simplifying/reducing
    • A3: Separating whole number from fraction
    • A4: Borrowing from whole number
  • True Q-matrix (\(Q_{true}\)) available for direct validation

Study 2: Stability of Q-Matrices

Initial Q-matrix Variability

Validated Q-matrix Variability
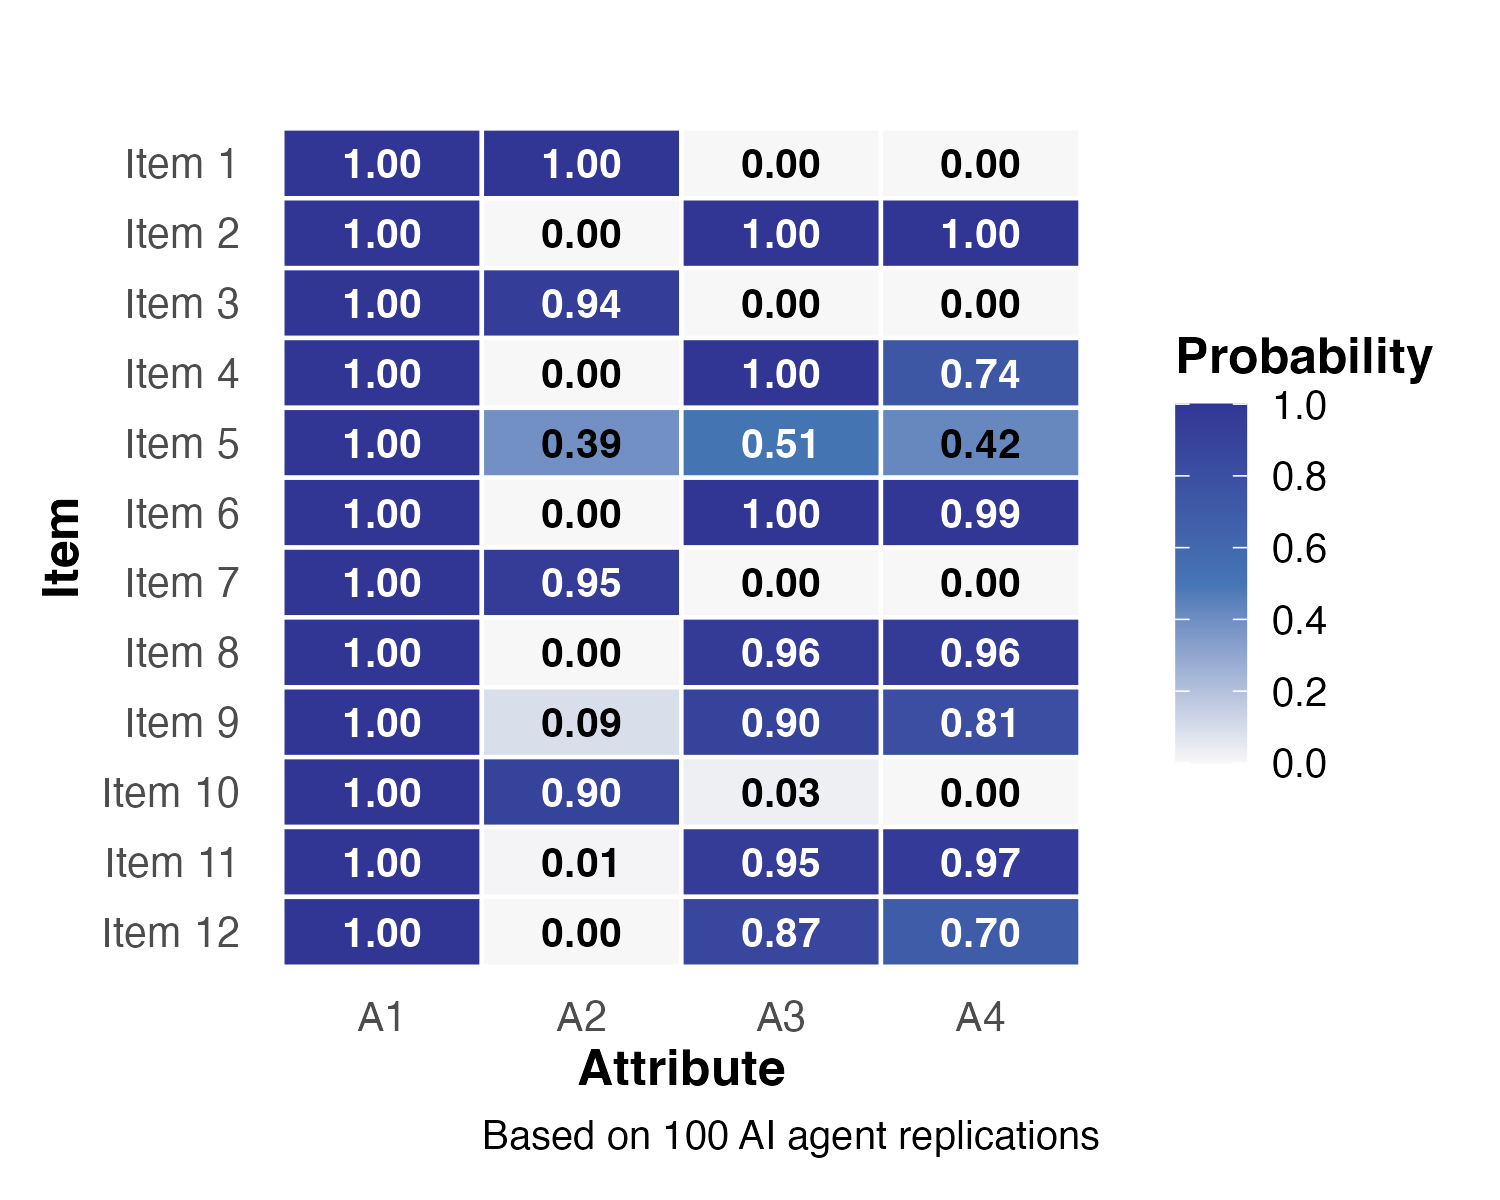
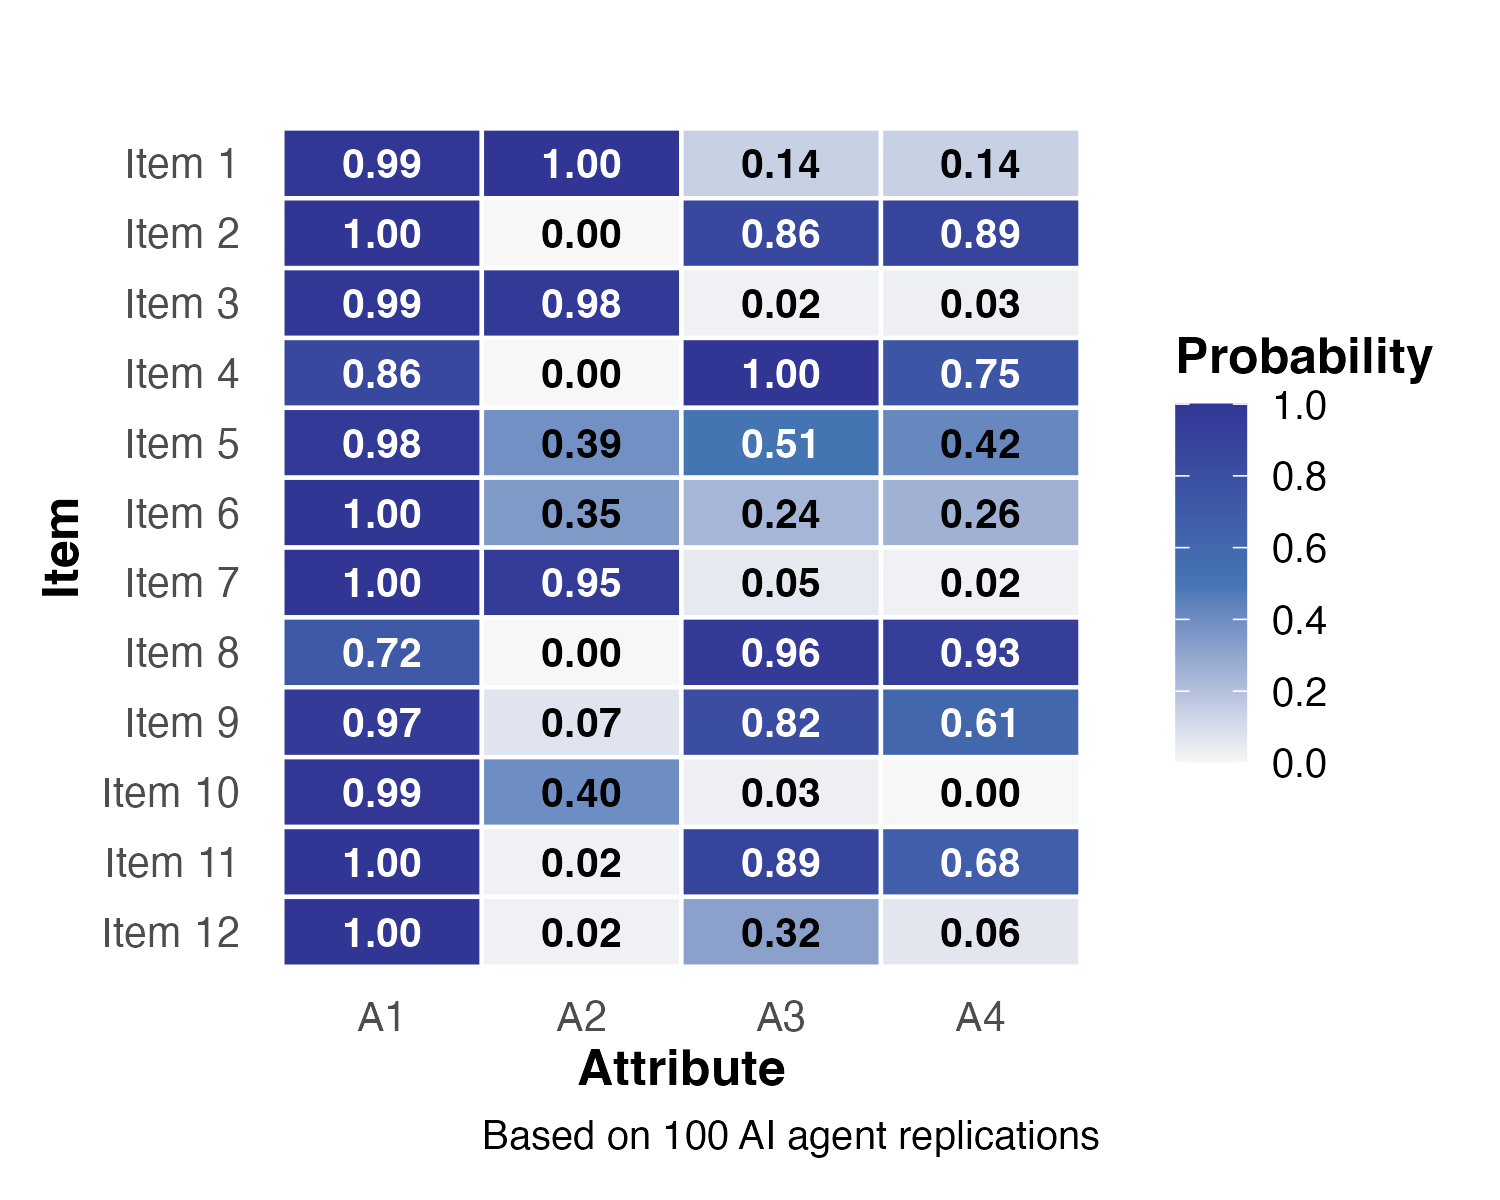
  • A1 assigned with perfect certainty (\(p = 1.0\)) across all items
  • Items 5 and 12 showed notable shifts after validation
  • Item 12: A3 probability dropped from 0.87 to 0.32; A4 from 0.70 to 0.06

Study 2: Overlap Rates

Initial Q-matrix vs. \(Q_{true}\): Overall OR = 0.71 (95% CI [0.71, 0.72])

  • A1: 1.00 | A2: 0.37 | A3: 0.85 | A4: 0.63

Validated Q-matrix vs. \(Q_{true}\): Overall OR = 0.65 (95% CI [0.64, 0.66])

  • A1: 0.96 | A2: 0.44 | A3: 0.70 | A4: 0.49
  • A2 improved slightly (0.37 \(\rightarrow\) 0.44), but A3 and A4 declined after validation

Study 2: Final Q-Matrix Results

Overlap rates across four finalization plans (Study 2)
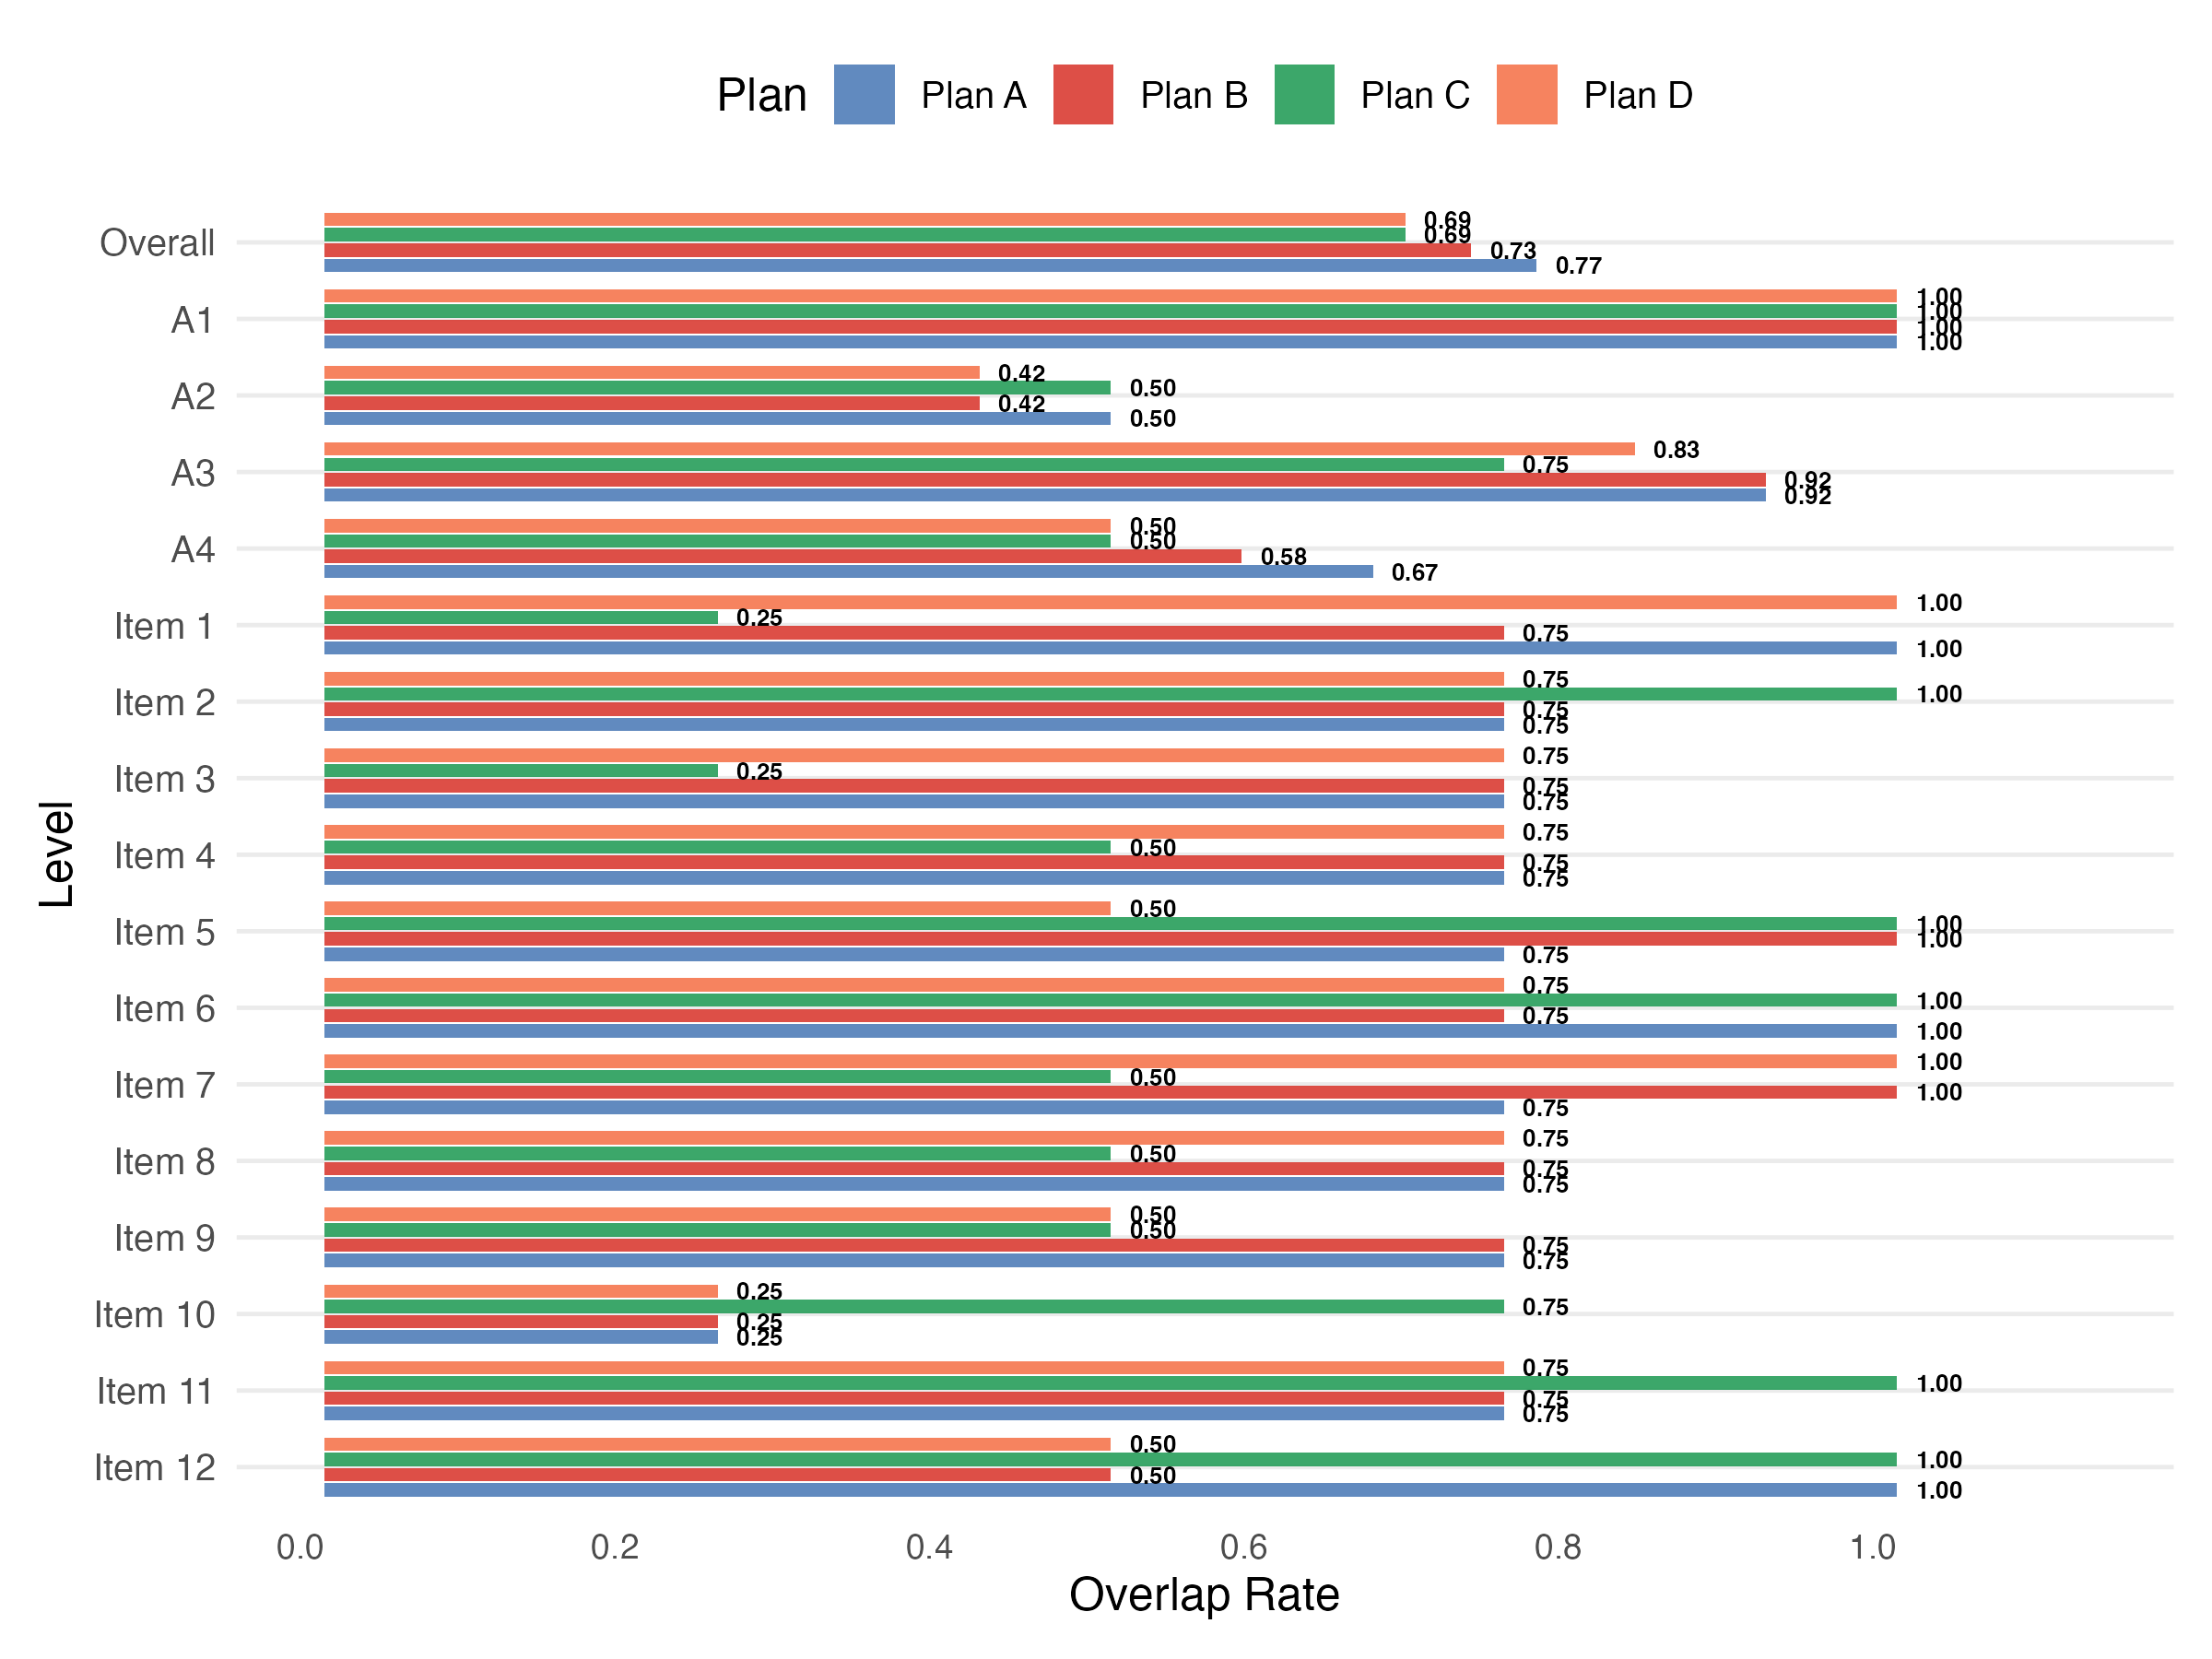
  • Plan A produced the highest overall OR (0.77)
  • Plans C and D yielded the lowest (0.69)
  • A1 (basic subtraction): perfect overlap (1.00) across all plans
  • A2 (simplifying): most challenging attribute to classify
  • Item 10 had lowest item-level OR (0.25) across all plans
  • Opposite pattern from Study 1 — optimal strategy depends on construct nature

6 Discussion

Summary of Findings

Study 1 (SAD) Study 2 (Fraction)
Initial OR 0.90 0.71
Validated OR 0.77 0.65
Best Plan B/C/D (0.77) A (0.77)
Challenging Attribute A2 (close scrutiny) A2 (simplifying)
  • Initial Q-matrices generally stable across 100 replications
  • Data-driven validation can conflict with substantive attribute definitions
  • No single finalization plan is universally optimal

Limitations & Future Directions

  • Performance depends on clarity of attribute definitions — overlapping constructs show greater variability
  • PVAF-based validation optimizes empirical fit, which may not align with substantive meaning
  • Future work:
    • Compare centralized vs. decentralized multi-agent architectures
    • Test alternative LLMs (GPT-4, Claude) and validation methods
    • Explore adaptive selection rules for finalization strategies
    • Evaluate whether fewer replications (e.g., 20–30) yield stable estimates

Thank You

Questions?

Contact: jzhang@uark.edu