As contributors of the R package said in their github website:
“The forester package is an AutoML tool in R that wraps up all machine learning processes into a single train() function, which includes:”
rendering a brief data check report,
preprocessing initial dataset enough for models to be trained,
training 5 tree-based models with default parameters, random search and Bayesian optimization,
evaluating them and providing a ranked list.
In this blog, I will introduce forester package as a case study using a simulation example and a real example.
graph TD;
    A[data check]-->B;
    A-->C;
    B-->D;
    C-->D;
1 Useful links
One of the contributor, Hubert Ruczynski, wrote up a detailed tutorial published in Mar 1, 2023.
2 An example
First of all, forester::check_data is a very convenient function to glimpse the data for data analysis. By default it will output a “CHECK DATA REPORT”, including some data quality checking list, meanwhile it will also do Spearman correlations.
 -------------------- CHECK DATA REPORT --------------------

The dataset has 150 observations and 5 columns, which names are:
Sepal.Length; Sepal.Width; Petal.Length; Petal.Width; Species;

With the target value described by a column Species.

✔ No static columns.

✔ No duplicate columns.

✔ No target values are missing.

✔ No predictor values are missing.

✔ No issues with dimensionality.

✖ Strongly correlated, by Spearman rank, pairs of numerical values are:

 Sepal.Length - Petal.Length: 0.87;
 Sepal.Length - Petal.Width: 0.82;
 Petal.Length - Petal.Width: 0.96;

✖ These observations migth be outliers due to their numerical columns values:
 16 ;

✖ Multilabel classification is not supported yet.

✔ Columns names suggest that none of them are IDs.

✔ Columns data suggest that none of them are IDs.

 -------------------- CHECK DATA REPORT END --------------------
---title: "A tutorial for forester R package"author: "Jihong Zhang"description: ""date: "2023-06-28"categories: - tutorial - packagetoc: truecode-fold: showcode-summary: ' R Code'code-line-numbers: falsenumber-sections: truenumber-offset: 1---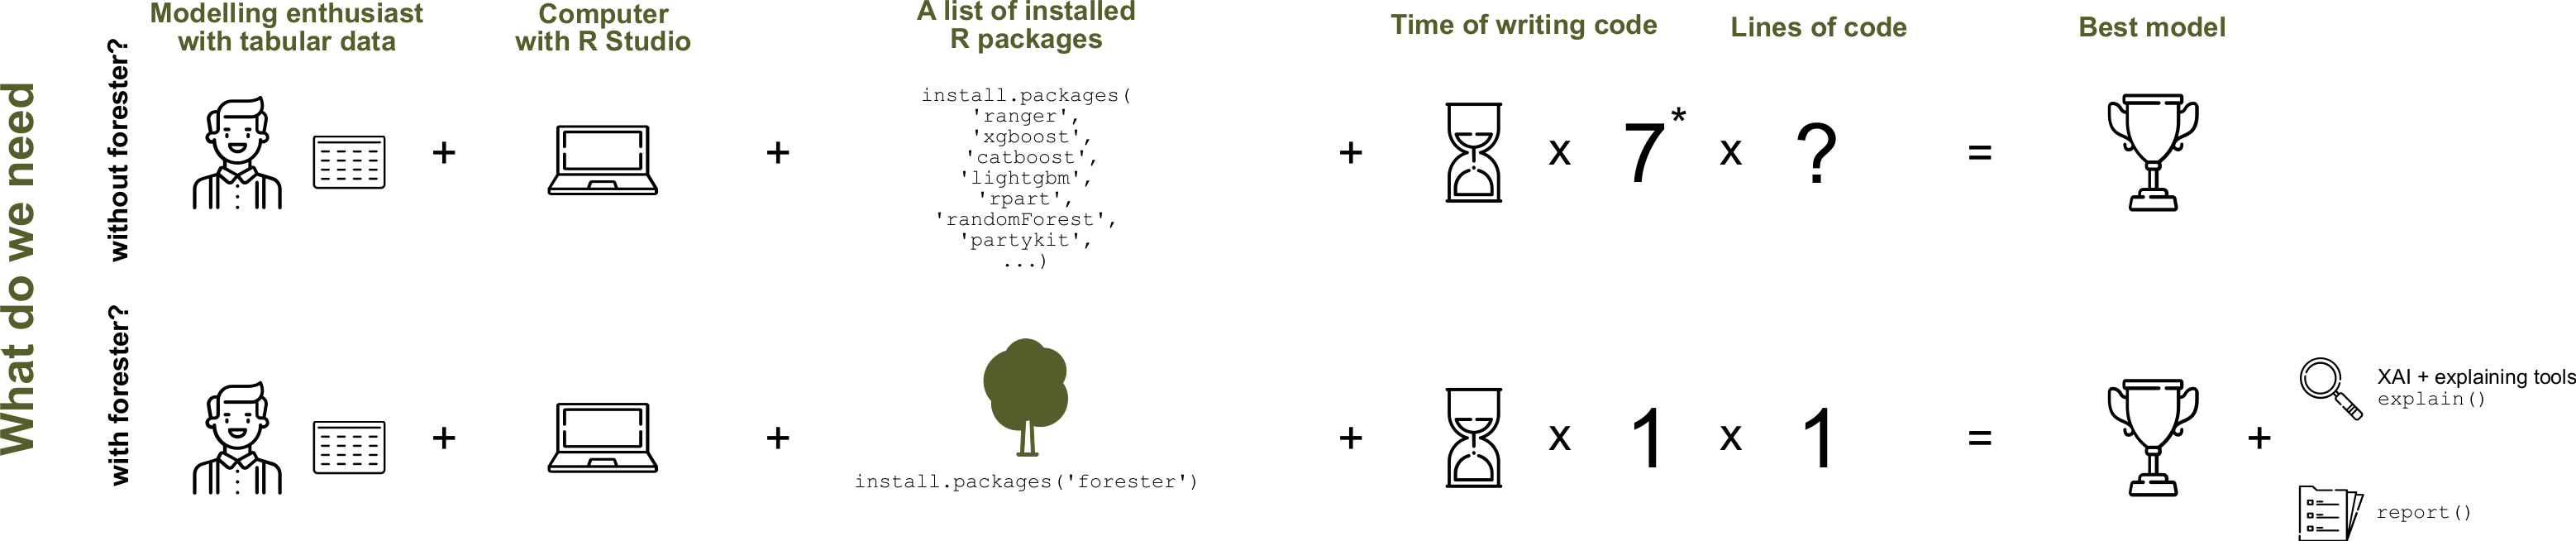{fig-align="center" width="1000"}```{r}#| label: setup#| eval: false#| message: false#| warning: falseknitr::opts_chunk$set(echo =TRUE, message=FALSE, warnings=FALSE, include =FALSE)options(knitr.kable.NA ='')library('tidyverse')library('forester')mycolors =c("#4682B4", "#B4464B", "#B4AF46", "#1B9E77", "#D95F02", "#7570B3","#E7298A", "#66A61E", "#B4F60A")softcolors =c("#B4464B", "#F3DCD4", "#ECC9C7", "#D9E3DA", "#D1CFC0", "#C2C2B4")mykbl <-function(x, ...){kbl(x, digits =2, ...) |>kable_styling(bootstrap_options =c("striped", "condensed")) }```As contributors of the R package said in their [github website](https://github.com/ModelOriented/forester):> "The *forester* package is **an AutoML tool in R** that wraps up all machine learning processes into a single `train()` function, which includes:"- rendering a brief **data check** report,- **preprocessing** initial dataset enough for models to be trained,- **training** 5 tree-based models with default parameters, random search and Bayesian optimization,- **evaluating** them and providing a ranked list.In this blog, I will introduce `forester` package as a case study using a simulation example and a real example.```{mermaid}graph TD; A[data check]-->B; A-->C; B-->D; C-->D;```## Useful links- One of the contributor, Hubert Ruczynski, wrote up a detailed [tutorial](https://medium.com/responsibleml/forester-predicting-house-prices-use-case-b537253b6142) published in Mar 1, 2023.## An exampleFirst of all, `forester::check_data` is a very convenient function to glimpse the data for data analysis. By default it will output a "CHECK DATA REPORT", including some data quality checking list, meanwhile it will also do Spearman correlations.```{r}check_dat_res <- forester::check_data(iris, 'Species')``````{r}str(check_dat_res$str)```
